Published by
Opsolute Team
on

Introduction
Every action in your AWS environment leaves a digital footprint, but are you tracking the right ones? CloudTrail and CloudWatch are both essential AWS monitoring tools, yet they serve fundamentally different purposes. While CloudTrail acts as your security camera recording who did what and when, CloudWatch functions as your performance dashboard showing how your resources are running. Understanding the distinction between these tools is not just important for engineers but critical for finance and leadership teams, as both services can quietly rack up costs while solving different problems.
Key Highlights
What you need to know about CloudTrail vs CloudWatch:
CloudTrail tracks WHO did WHAT: Complete audit trail of API calls and user actions across your AWS account
CloudWatch monitors HOW things RUN: Real-time metrics, logs, and system health for performance optimization
CloudTrail = Security and Compliance: Forensic investigation, regulatory compliance, and change tracking
CloudWatch = Performance and Operations: Resource utilization, automated scaling, and proactive issue detection
Both work together: Integration enables comprehensive visibility from security events to performance impacts
Different cost models: CloudTrail offers 90 days free for management events; CloudWatch charges based on metrics volume
What is AWS CloudTrail?
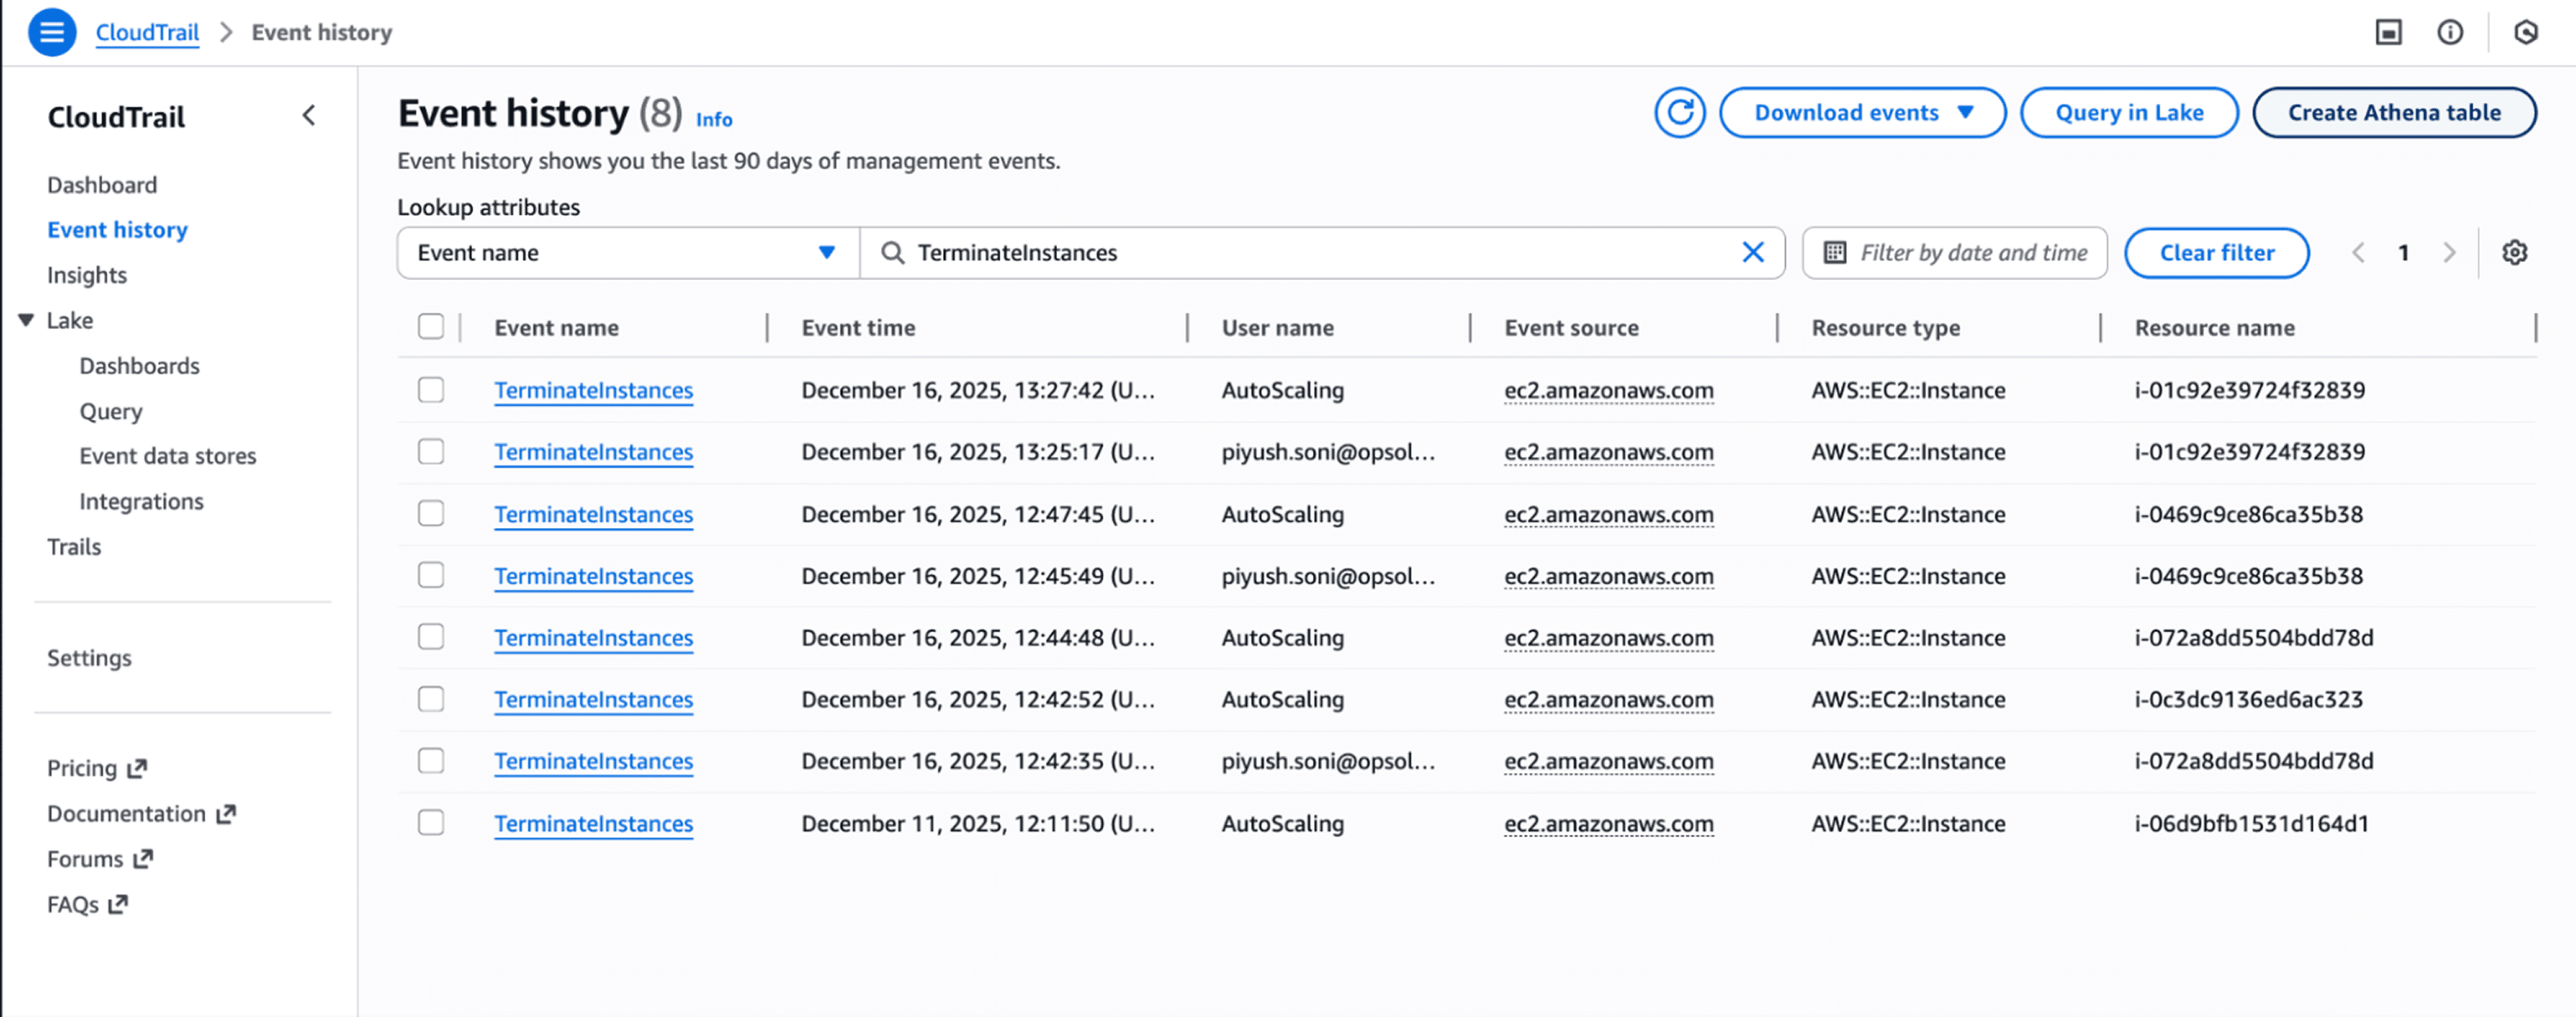
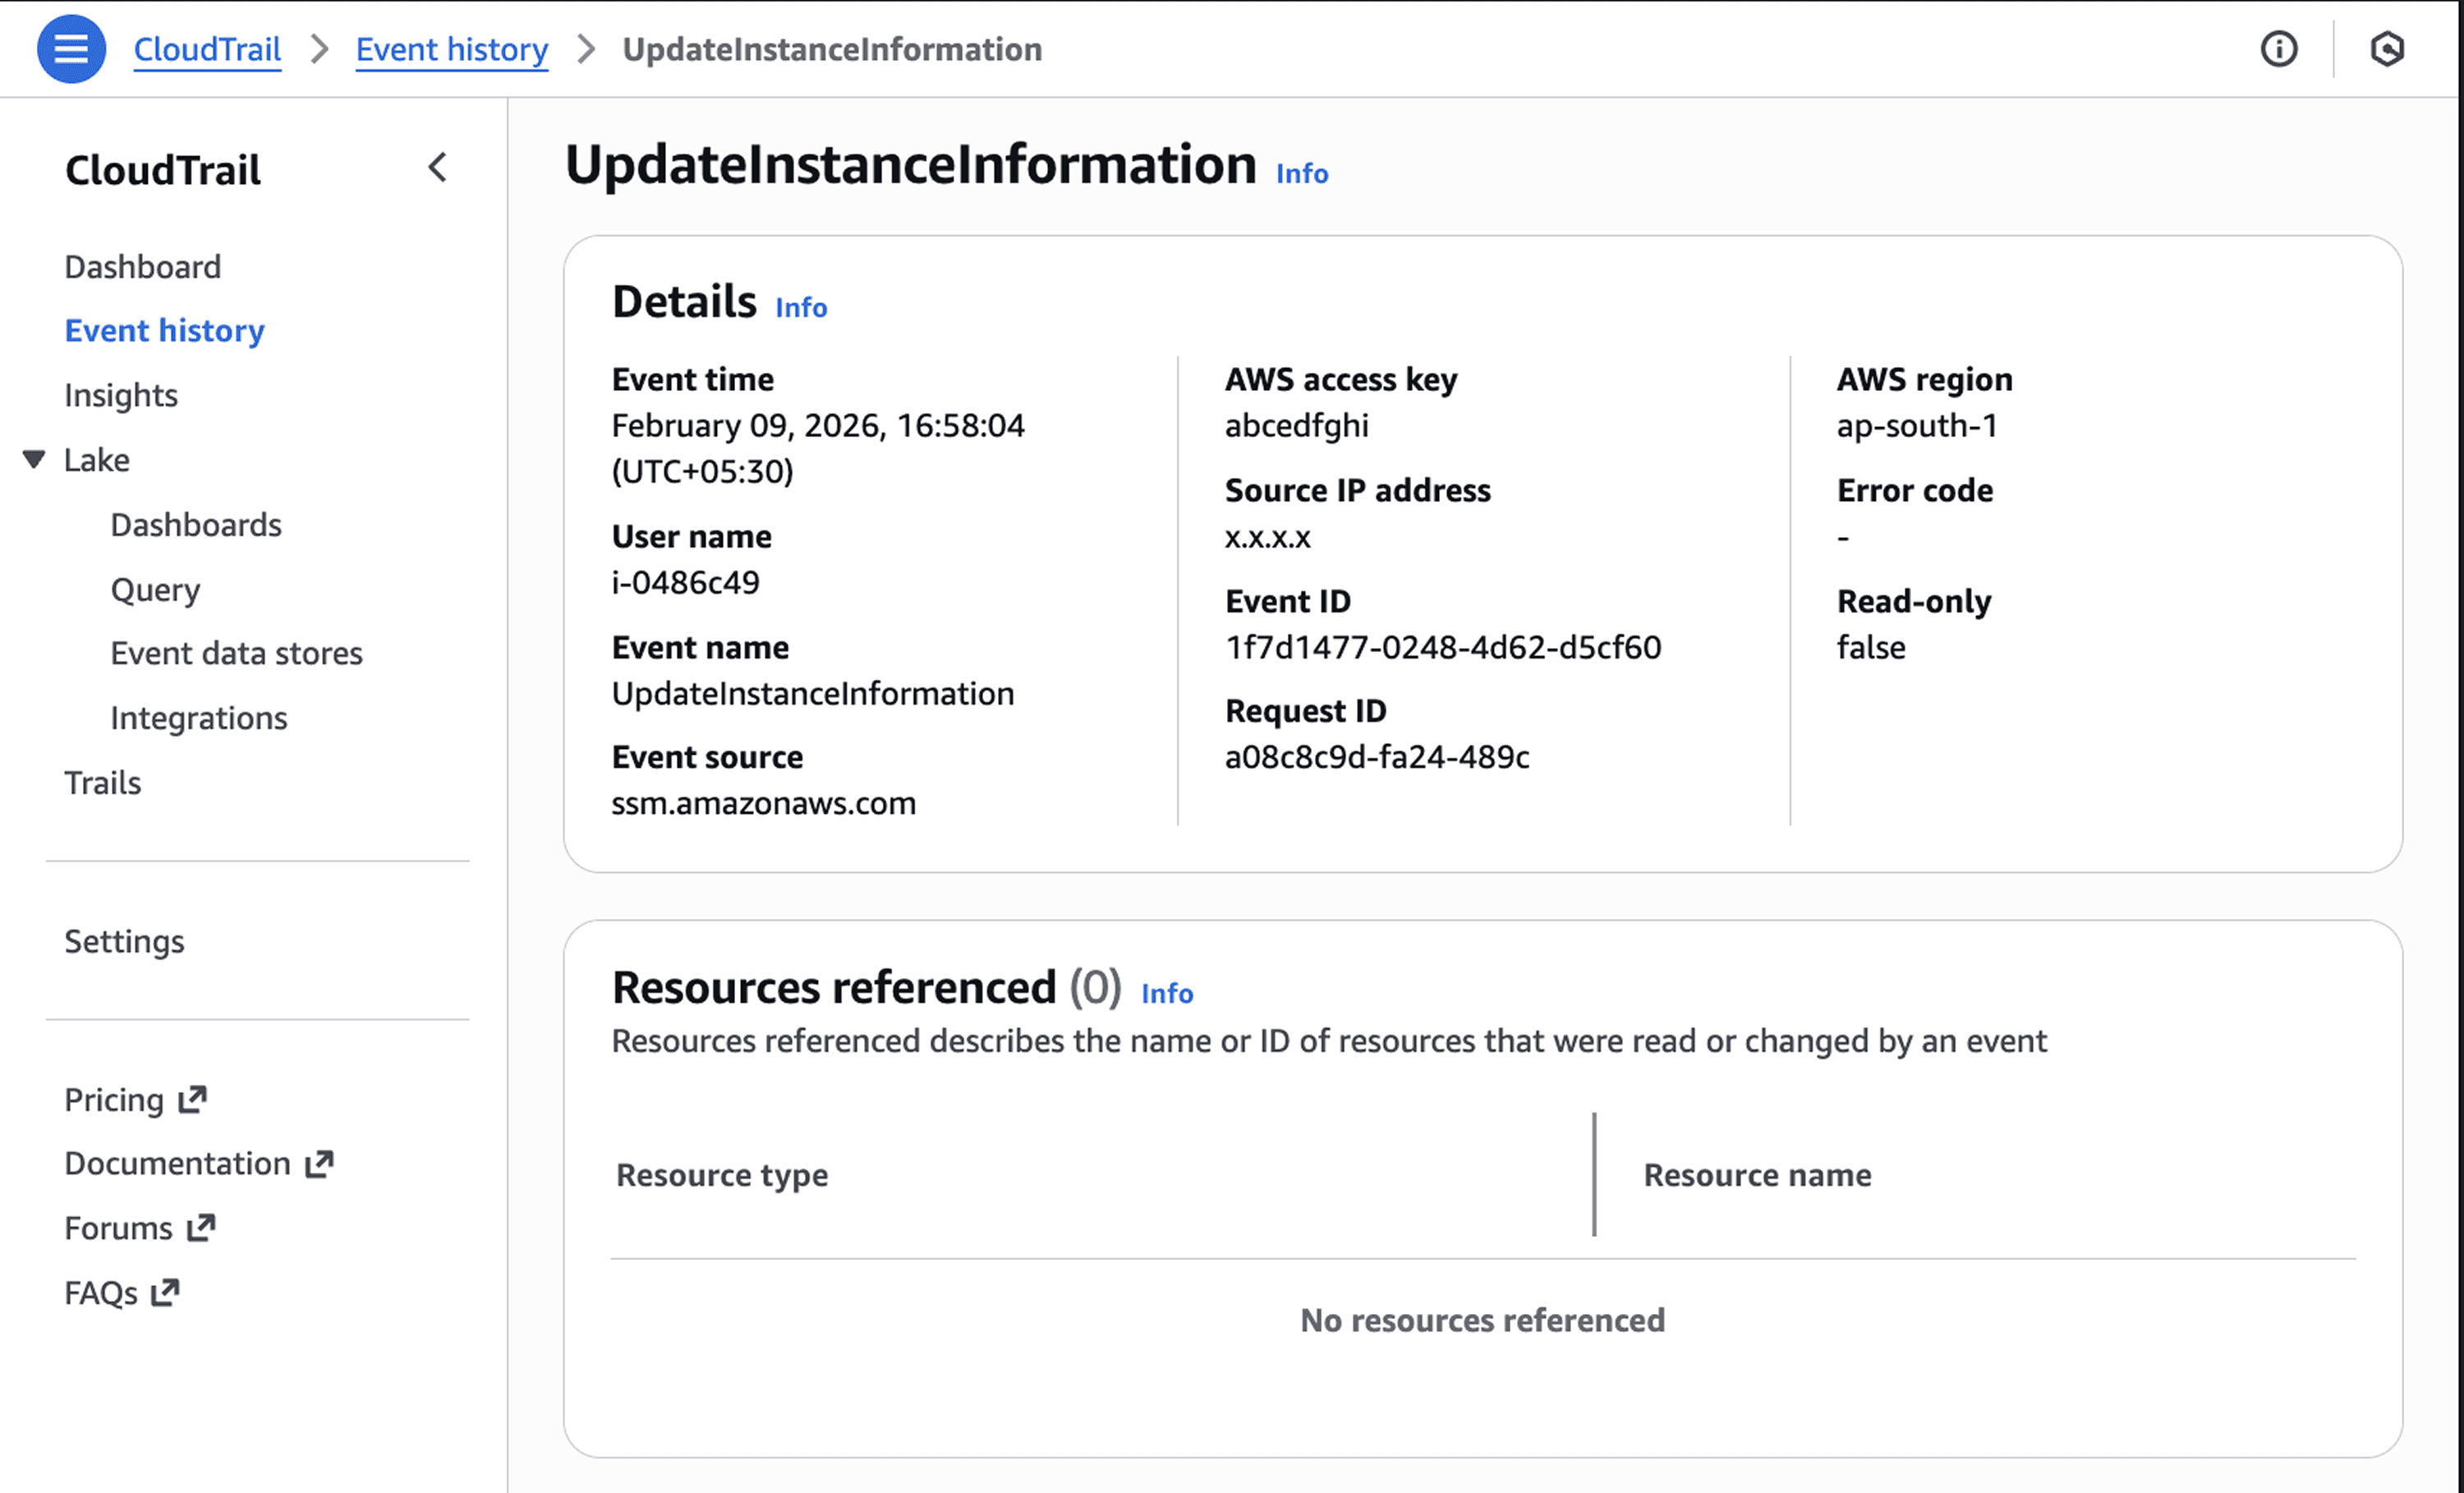
CloudTrail serves as your AWS account's comprehensive audit log, recording every API call and user action across all services. Think of it as a black box recorder for your cloud infrastructure. When someone creates an S3 bucket, modifies an IAM policy, or terminates an EC2 instance, CloudTrail captures who made the change, when it occurred, which IP address they used, and what parameters they specified.
The service automatically logs management events for 90 days through Event History at no charge. This gives you immediate visibility into recent account activity without any configuration. For long-term retention or to capture data events (like S3 object-level activity), you need to create a trail that delivers logs to an S3 bucket.
CloudTrail excels at answering accountability questions. When your monthly AWS bill shows an unexpected $4,000 spike, CloudTrail tells you exactly which engineer launched those 20 untagged test instances. When a security group suddenly opens port 22 to the internet, CloudTrail reveals who made the change and from where. CloudTrail Lake extends this capability by storing events for up to 10 years in an optimized format that supports SQL queries.
CloudTrail Event Types | What They Capture | Cost |
Management Events | Resource creation, modification, deletion (control plane) | First copy free per region |
Data Events | S3 object access, Lambda invocations (data plane) | $0.10 per 100,000 events |
Network Activity Events | VPC endpoint API calls and denied access | Same as data events |
Insights Events | Unusual API activity and anomalies | $0.35 per 100,000 events analyzed |
What is AWS CloudWatch?
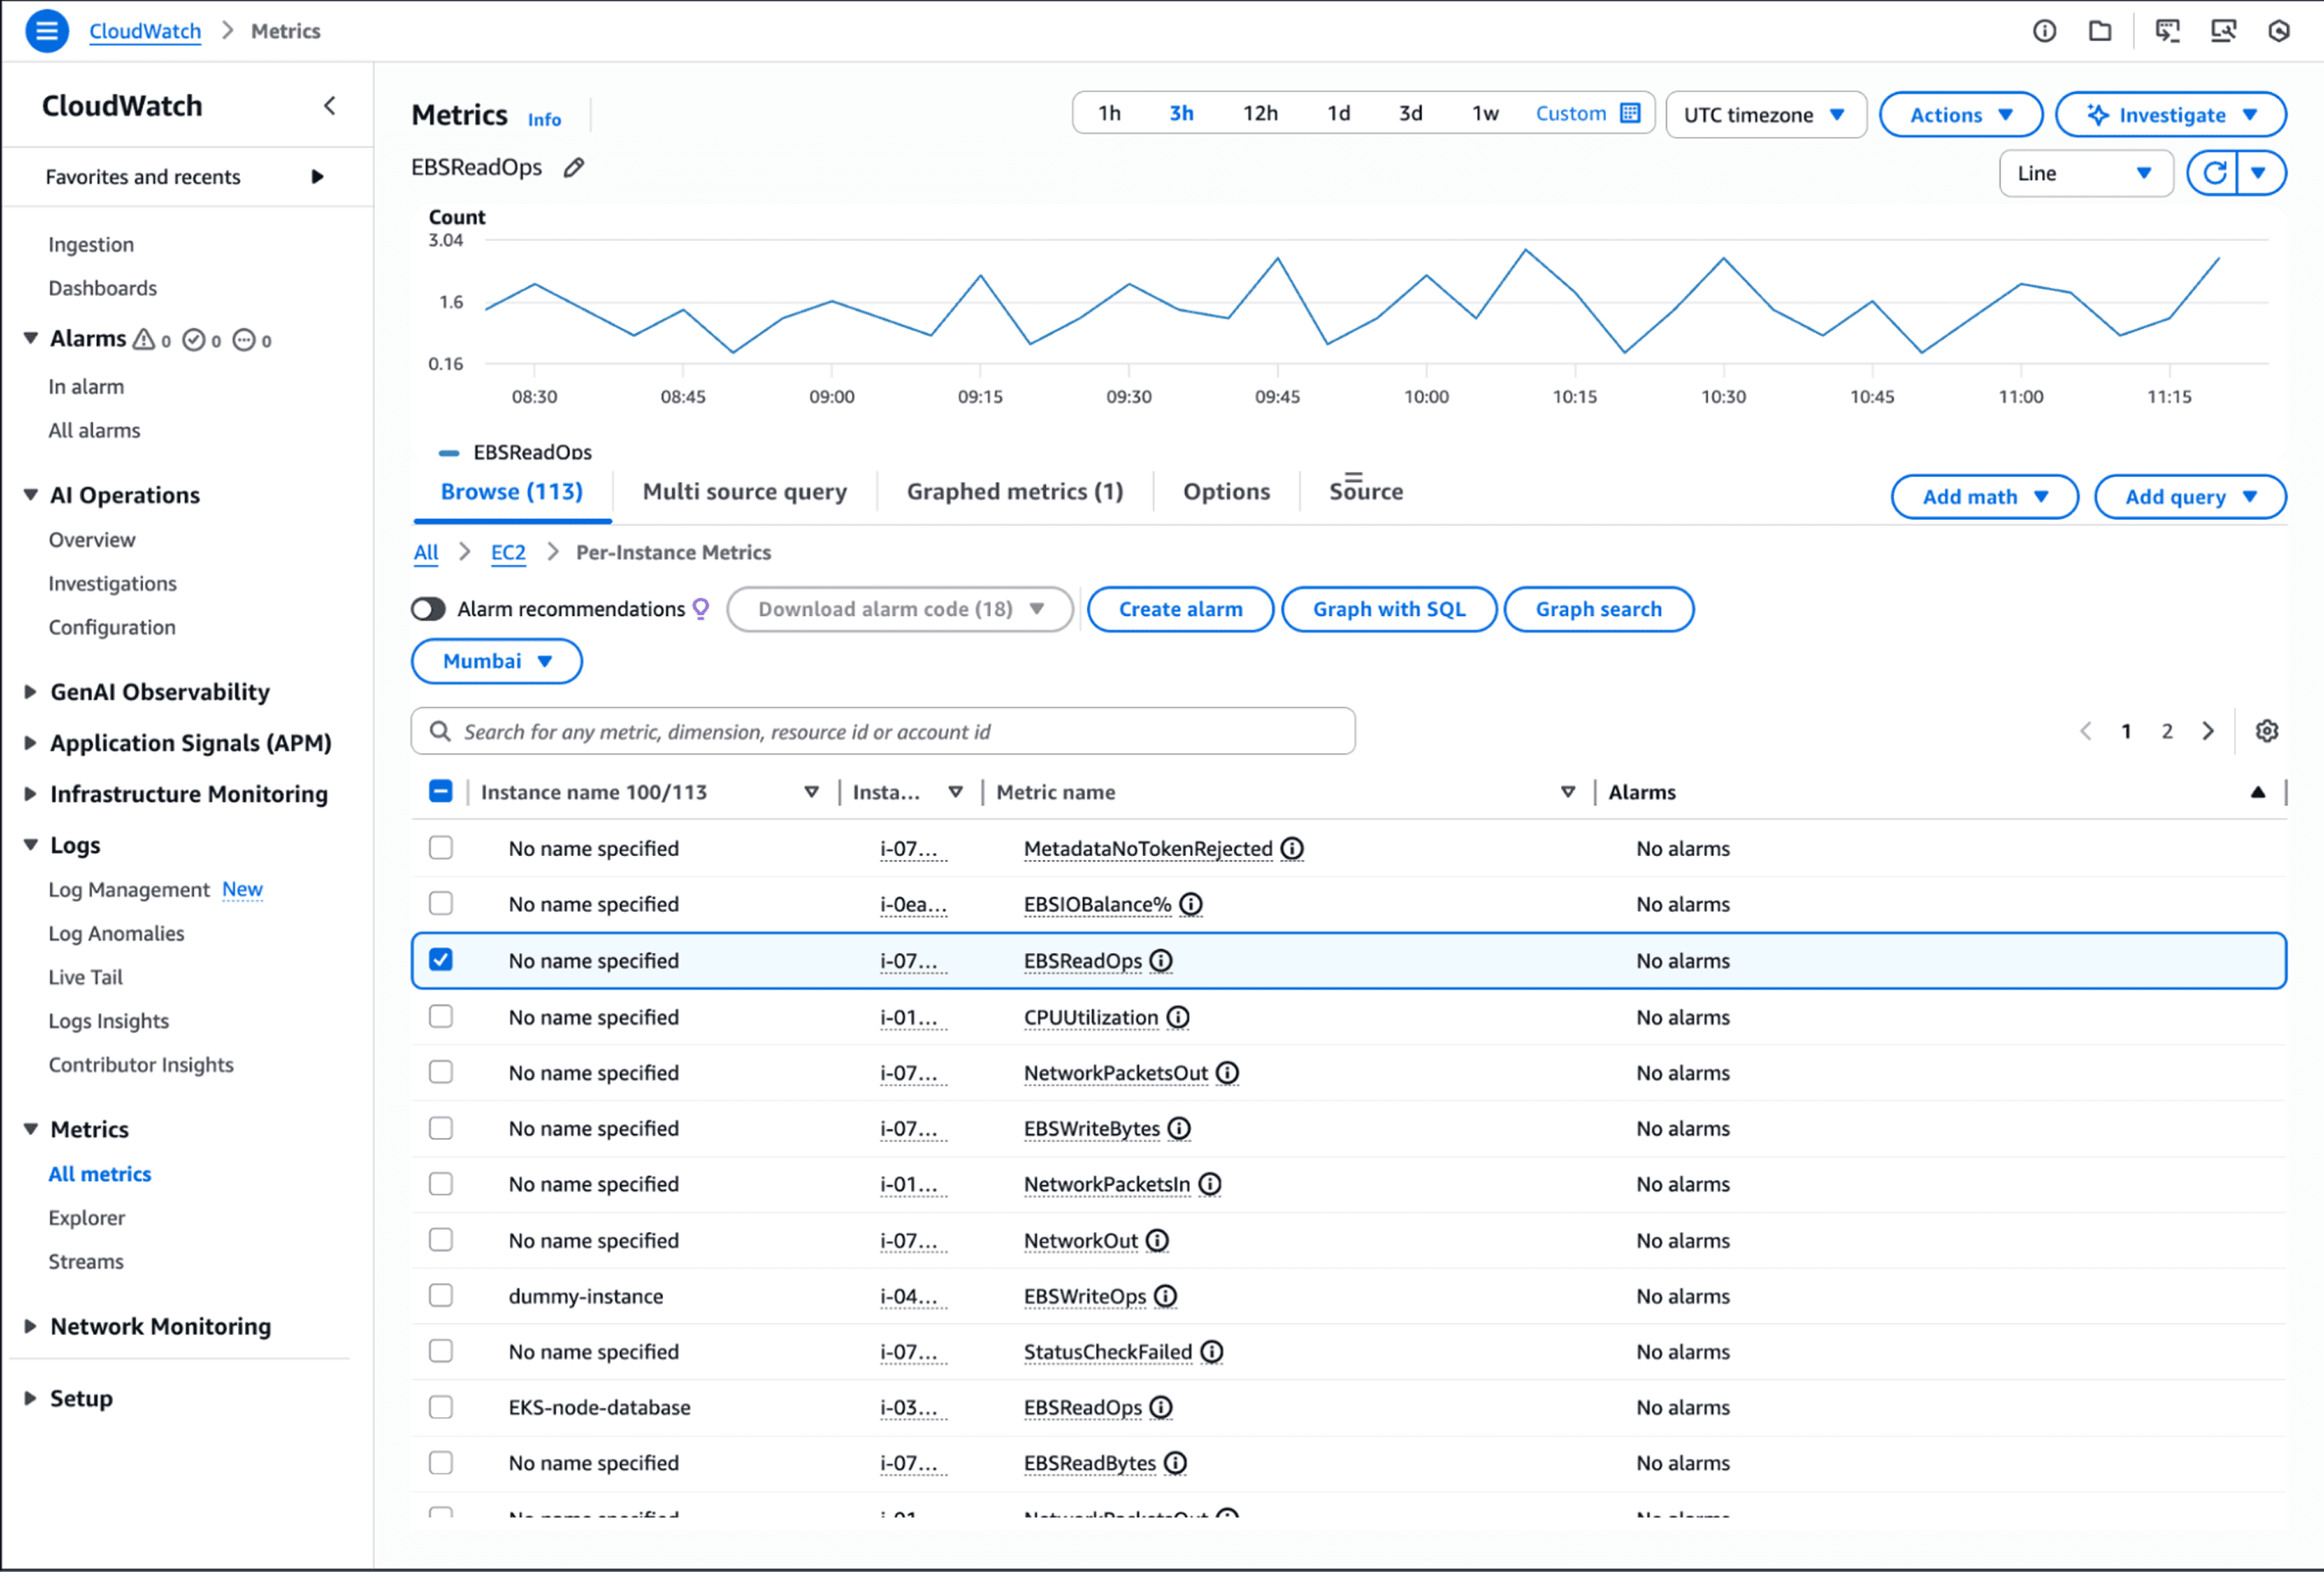
CloudWatch operates as AWS's central monitoring and observability service, collecting metrics, logs, and events from resources and applications in near real-time. Unlike CloudTrail's focus on "who did what," CloudWatch answers "how is it performing?" It tracks CPU utilization, memory consumption, network traffic, disk I/O, and custom application metrics.
The service provides one-second visibility into your environment's health. CloudWatch retains metrics for 15 months, allowing historical analysis for cost optimization and performance trending. You can create dashboards that visualize your entire stack, set alarms that trigger automated responses, and analyze logs using SQL-based queries.
CloudWatch shines in operational scenarios. When your application response times spike, CloudWatch shows you which component is struggling. When an EC2 instance hits 90% CPU, CloudWatch can automatically scale your Auto Scaling group. Container Insights, Lambda Insights, and Database Insights provide specialized monitoring for containerized applications, serverless functions, and databases without requiring custom instrumentation.
Pro Tip: CloudWatch's anomaly detection uses machine learning to identify unusual patterns in your metrics without manual threshold configuration. This catches issues that static alarms miss, like gradual performance degradation or cyclical usage spikes.
Core Differences: CloudTrail vs CloudWatch
The fundamental distinction between CloudTrail and CloudWatch comes down to audit vs performance monitoring. CloudTrail maintains an immutable record of actions taken, while CloudWatch measures how efficiently your resources operate.
Purpose and Focus:
CloudTrail: Governance, compliance, security auditing, forensic investigation
CloudWatch: Performance monitoring, resource optimization, operational health, troubleshooting
Data Collection:
CloudTrail: API calls, user actions, configuration changes, authentication events
CloudWatch: Metrics (CPU, memory, network), logs, application traces, custom measurements
Time Characteristics:
CloudTrail typically delivers events within 15 minutes of the actual API call
CloudWatch: Near real-time (1-second to 5-minute intervals depending on monitoring type)
Primary Users:
CloudTrail: Security teams, compliance officers, auditors, forensic investigators
CloudWatch: DevOps engineers, SREs, application developers, operations teams
[DIAGRAM NEEDED: Side-by-side comparison showing CloudTrail's audit trail flow (User Action → API Call → CloudTrail Event → S3/CloudWatch Logs) versus CloudWatch's monitoring flow (Resource → Metrics Collection → Dashboard/Alarm → Automated Response)]
When to Use CloudTrail: Key Use Cases
Security Auditing and Compliance: CloudTrail is mandatory for regulatory frameworks like SOC 2, PCI-DSS, HIPAA, and GDPR. The service ensures continuous compliance by logging all activities and plays a vital role in audits and investigations. When auditors ask "prove that only authorized personnel accessed customer data," CloudTrail provides the evidence.
Forensic Investigation: After a security incident, CloudTrail becomes your crime scene investigator. Track the complete timeline of a breach: when the attacker gained access, which resources they compromised, what data they exfiltrated. Filter by IP address, user identity, or resource to reconstruct the attack chain.
Change Tracking and Troubleshooting: When a production deployment mysteriously fails, CloudTrail shows which team member updated the IAM role that broke the pipeline. When developers insist "we didn't change anything," CloudTrail proves otherwise by revealing the UpdateSecurityGroup call from 2:47 AM.
Real-World Example: A fintech company discovered $28,000 in unexplained S3 storage costs. CloudTrail logs revealed a contractor had created 200 buckets for testing six months earlier and never deleted them. The audit trail showed every CreateBucket call, the IAM user responsible, and the exact timestamps.
When to Use CloudWatch: Key Use Cases
Performance Monitoring and Optimization: CloudWatch catches performance issues before they impact users. Monitor application response times, database query latency, and API error rates. When metrics cross thresholds, CloudWatch triggers alarms that page on-call engineers or automatically scale resources.
Cost Management Through Utilization: Right-sizing decisions require data. CloudWatch shows you which EC2 instances consistently run at 15% CPU, which RDS databases have excessive IOPS capacity, and which Lambda functions could use less memory. This intelligence drives 40-60% cost reductions in over-provisioned environments.
Automated Scaling and Remediation: CloudWatch alarms don't just alert, they act. When API error rates spike, automatically increase Lambda concurrency. When queue depth grows, scale EC2 worker instances. When disk space drops below 20%, trigger a cleanup script.
Application Health Tracking: Custom metrics reveal business-level health. Track orders per minute, authentication success rates, payment gateway response times, or any metric specific to your application. CloudWatch makes these metrics as accessible as infrastructure metrics.
CloudTrail Use Case | CloudWatch Use Case | Which Tool to Use |
Who deleted the production database? | Why is database performance degrading? | CloudTrail |
Prove compliance with access policies | Monitor database query latency | CloudWatch |
Track unauthorized resource creation | Optimize resource utilization | Both |
Investigate security breach timeline | Detect performance anomalies | CloudTrail primary |
Audit configuration changes | Set up auto-scaling triggers | CloudWatch primary |
How CloudTrail and CloudWatch Work Together
CloudWatch can consume the passive history of events that CloudTrail tracks, and the two can generate alarms that activate if any unusual patterns emerge. This integration transforms static audit logs into actionable security intelligence.
Security Alerting Integration: Send CloudTrail logs to CloudWatch Logs, then create metric filters that count specific API activities. When failed login attempts exceed 10 per minute, CloudWatch alarms notify your security team. When someone creates an IAM user with admin privileges, you get alerted immediately.
Correlating Changes with Performance: Application suddenly slowing down? Check CloudTrail for recent configuration changes around the same time CloudWatch detected the performance drop. Often you'll find a security group modification, IAM policy update, or scaling configuration change that explains the issue.
Complete Incident Response: CloudTrail answers "what happened and who did it." CloudWatch answers "what was the impact and duration." Together, they provide the full incident timeline: unauthorized API call at 14:23 (CloudTrail), performance degradation detected at 14:25 (CloudWatch), issue resolved at 14:47 (both services).
Pricing Comparison: CloudTrail vs CloudWatch
CloudTrail Costs: Management events are free for 90 days through Event History. Creating trails to deliver management events to S3 costs nothing for the first copy per region. Data events run $0.10 per 100,000 events. CloudTrail Lake charges $2.50 per GB ingested with one-year retention pricing.
When integrating with CloudWatch, you pay twice: $0.25 per GB for CloudTrail delivery plus $0.50 per GB for CloudWatch Logs ingestion. For organizations processing 1 TB monthly, that's $768 just for integration.
CloudWatch Costs: Basic monitoring is free for EC2 instances (seven metrics at five-minute intervals). Detailed monitoring costs extra. Minimal CloudWatch usage typically runs $1-10 monthly, moderate usage with alarms costs $20-50, and high-volume implementations can exceed $200-300 monthly.
Custom metrics cost $0.30 per metric per month. Alarms run $0.10 each per month. Log ingestion to CloudWatch Logs costs $0.50 per GB. These charges accumulate quickly in large environments with hundreds of metrics and dozens of alarms.
Cost Reality Check: A mid-sized SaaS company monitoring 50 services with 10 custom metrics each, 30 alarms, and 100 GB monthly logs pays approximately $225 for CloudWatch alone. Add CloudTrail data events for S3 buckets storing customer data, and the monitoring bill approaches $400-500 monthly.
Common Mistakes and Best Practices
Mistake 1: Expecting CloudWatch to Provide Security Audit Trails CloudWatch logs application and system events, but doesn't inherently track who made changes. You need CloudTrail for "who did what" accountability. Don't rely on CloudWatch alone for compliance auditing.
Mistake 2: Failing to Enable CloudTrail Across All Regions A trail can be created for all AWS regions or only one. Single-region trails create blind spots. Always use multi-region trails to ensure comprehensive coverage, especially since attackers often operate in less-monitored regions.
Mistake 3: Ignoring Data Retention and Storage Costs CloudTrail's 90-day Event History is free but limited. Creating multiple trails that log the same management events to different destinations incurs unnecessary charges. Plan your retention strategy carefully. Most organizations need 1-2 years for compliance, not 10 years.
Mistake 4: Over-Monitoring with CloudWatch Tracking every possible metric creates noise and cost. Start with critical metrics: application error rates, resource utilization for expensive services, and user-facing performance indicators. Add more as needs emerge.
Best Practices:
Enable CloudTrail Insights to detect unusual API activity automatically
Use CloudWatch anomaly detection instead of static thresholds
Create CloudWatch dashboards that correlate metrics across services
Set up CloudWatch alarms that trigger automated remediation, not just notifications
Review CloudTrail and CloudWatch costs monthly using Cost Explorer
Implement log lifecycle policies to move old logs to cheaper storage tiers
Unified Cloud Monitoring with Opsolute
While CloudTrail and CloudWatch provide essential AWS monitoring capabilities, managing multiple monitoring tools across multi-cloud environments creates complexity. Teams struggle to correlate security events from CloudTrail with cost impacts shown in CloudWatch metrics, leading to fragmented visibility and slow incident response.
Opsolute consolidates insights from CloudTrail, CloudWatch, and other cloud-native tools into a unified dashboard that provides real-time visibility across AWS & GCP. The platform's anomaly detection automatically identifies unusual spending patterns that CloudTrail logs and CloudWatch metrics reveal separately, connecting the dots between who made changes and how those changes impact costs and performance.
The FinOps capabilities help teams understand the financial implications of API activities logged by CloudTrail. When CloudTrail shows a team launched 50 new EC2 instances, Opsolute's dashboard immediately displays the cost impact, budget consumption, and optimization opportunities. CloudWatch metrics feed into Opsolute's right-sizing recommendations, enabling data-driven decisions that balance security, performance, and budget.
Schedule a demo to see how Opsolute brings CloudTrail and CloudWatch insights together for complete visibility across your multi-cloud environment.
Frequently Asked Questions
Q: Can I use CloudWatch instead of CloudTrail for security monitoring? A: No, CloudWatch and CloudTrail serve different purposes. CloudWatch monitors resource performance and operational metrics, while CloudTrail provides the audit trail of who accessed what and when. For security monitoring, you need CloudTrail to track API calls and user actions. However, you can integrate CloudTrail logs with CloudWatch to create security-related alarms and real-time alerts.
Q: Does CloudTrail track all actions automatically, or do I need to configure it? A: CloudTrail automatically logs management events for 90 days in Event History at no cost. However, for long-term storage, data events, or multi-region trails, you must create and configure a trail. Data events (like S3 object-level actions) and CloudTrail Insights require explicit enablement and incur additional charges.
Q: How quickly do CloudWatch and CloudTrail deliver monitoring data? A: CloudWatch provides near real-time monitoring with metrics updated every minute (or five minutes for basic monitoring). CloudTrail typically delivers events within 15 minutes but can emit events to EventBridge for near real-time alerting. Choose based on your latency requirements: CloudWatch for immediate performance issues, CloudTrail for audit purposes where slight delays are acceptable.
Q: Which service should I use to detect if someone deleted an EC2 instance? A: Use CloudTrail to identify who terminated the instance, when they did it, and from which IP address. CloudTrail logs the TerminateInstances API call with complete details. CloudWatch would show the performance metrics dropping to zero but wouldn't tell you who initiated the termination or why.
Q: Are CloudTrail and CloudWatch costs predictable? A: CloudTrail management events are free for 90 days, but data events and CloudTrail Lake incur costs based on volume. CloudWatch pricing varies by metrics volume, alarm count, and log ingestion. Both can become expensive at scale. Use retention policies, filter unnecessary logs, and monitor your monitoring costs regularly to avoid surprises.
Q: Can CloudWatch alarms be triggered by CloudTrail events? A: Yes, by integrating CloudTrail with CloudWatch Logs, you can create metric filters and alarms based on specific API activities. For example, you can set an alarm to notify your security team when someone creates a new IAM user with admin privileges or when failed login attempts exceed a threshold.
Q: Do I need both CloudTrail and CloudWatch for compliance? A: It depends on your compliance requirements. CloudTrail is essential for meeting audit requirements in frameworks like HIPAA, PCI-DSS, and SOC 2 as it provides the necessary API activity logs. CloudWatch supports operational compliance by ensuring systems meet performance SLAs. Most regulated industries require both for comprehensive compliance coverage.
Conclusion
CloudTrail vs CloudWatch is not an either-or decision. CloudTrail provides the security audit trail your compliance and security teams need, tracking every API call and configuration change with forensic precision. CloudWatch delivers the performance visibility your operations teams require, monitoring resource utilization and application health in real time.
Smart AWS teams use both services together. CloudTrail answers accountability questions while CloudWatch drives operational efficiency. The integration between these tools transforms passive audit logs into active security monitoring and correlates configuration changes with performance impacts.
Immediate Actions You Can Take:
Verify CloudTrail is enabled across all regions with at least one multi-region trail
Create CloudWatch dashboards for your critical services and set up essential alarms
Integrate CloudTrail logs with CloudWatch and configure alerts for sensitive API calls
Review your CloudTrail and CloudWatch costs in Cost Explorer to identify optimization opportunities
Implement automated responses to CloudWatch alarms for common issues like scaling or disk cleanup
The combination of CloudTrail's audit capabilities and CloudWatch's operational intelligence creates comprehensive AWS visibility. Start with the basics, add complexity as needs emerge, and remember that effective monitoring balances security, performance, and cost.
Stop guessing what your AWS bill will be next quarter.
Connect your AWS Organization in under 30 minutes. Most customers see their first chargeback report in 14 days and realize a 5–10× return on Opsolute within 90 days.
