Published by
Vishnu Siddarth
on

Introduction
Your dashboards are green. Alerts are configured. Monitoring is running smoothly. Yet somehow, customers report outages before your team notices them. Why?
The answer lies in understanding the critical distinction between observability and monitoring. While monitoring tells you when something breaks, observability reveals why it happened and how to prevent it. As systems shift toward microservices and cloud-native architectures, this difference has become mission-critical. Over 90% of new digital services now run on distributed architectures, and traditional monitoring alone can't keep pace.
This guide breaks down exactly what separates these approaches, when each applies, and how to implement them effectively in 2026 without breaking your budget.
Key Insights at a Glance
Before diving deep, here's what you need to know about observability vs monitoring in 2026:
Monitoring answers "what is broken" while observability answers "why it broke"
60% of organizations now have mature or expert observability practices, up from 41% in 2024
The three pillars (metrics, logs, traces) form the foundation of modern observability
84% of organizations struggle with unexpected observability costs, with median spend exceeding $800,000 annually per vendor
AI-powered observability is transforming from reactive diagnostics to predictive prevention
48.5% already use OpenTelemetry as the emerging standard, with 25% more planning adoption
The landscape is clear: observability has evolved from an optional capability to a mission-critical business function.
Understanding the Core Difference: What vs Why
Think of monitoring as your car's dashboard warning lights. When the check engine light turns on, you know there's a problem. That's monitoring at work. Observability, however, is like having a diagnostic computer that shows you exactly which sensor failed, why it triggered the light, and what other components might be affected.
Monitoring collects predefined metrics from individual system components. You set thresholds, configure alerts, and wait for something to breach those limits. It excels at tracking known failure modes. When CPU usage hits 90%, monitoring sounds the alarm.
But what happens when your application slows down and none of your predefined metrics explain why? This is where observability becomes essential. It aggregates metrics, logs, and traces across your entire distributed system, allowing you to ask questions you didn't anticipate. Instead of just seeing that response times increased, you can trace individual requests through dozens of microservices to find the exact bottleneck.
Aspect | Monitoring | Observability |
Focus | Predefined metrics and known issues | Unknown issues and root cause analysis |
Scope | Individual components | Entire distributed system |
Question | "Is something wrong?" | "Why is something wrong?" |
Approach | Reactive alerting | Proactive investigation |
Best For | Stable, predictable systems | Complex, distributed architectures |
The relationship between observability vs monitoring isn't competitive. They complement each other. Monitoring provides the early warning system, while observability gives you the investigative tools to diagnose and resolve complex issues.
The Evolution: From Monoliths to Microservices
A decade ago, monitoring was sufficient. Applications ran on a handful of servers with predictable behavior patterns. You monitored CPU, memory, disk, and network. When something failed, the problem was usually obvious.
Then everything changed. Cloud-native architectures exploded. A single user request now flows through dozens of microservices, each potentially running in different containers, across multiple cloud providers. That simple checkout process? It might touch authentication services, inventory systems, payment processors, recommendation engines, and shipping calculators, all operating independently.
Traditional monitoring breaks down in this environment. You might notice increased error rates, but good luck figuring out which of 47 microservices caused the problem. Was it the payment gateway? A database connection timeout? A misconfigured load balancer? Or an unexpected interaction between services that worked fine independently?
This complexity explains why 65% of organizations adopted systematic observability approaches. They needed visibility into service interactions, not just individual component health.
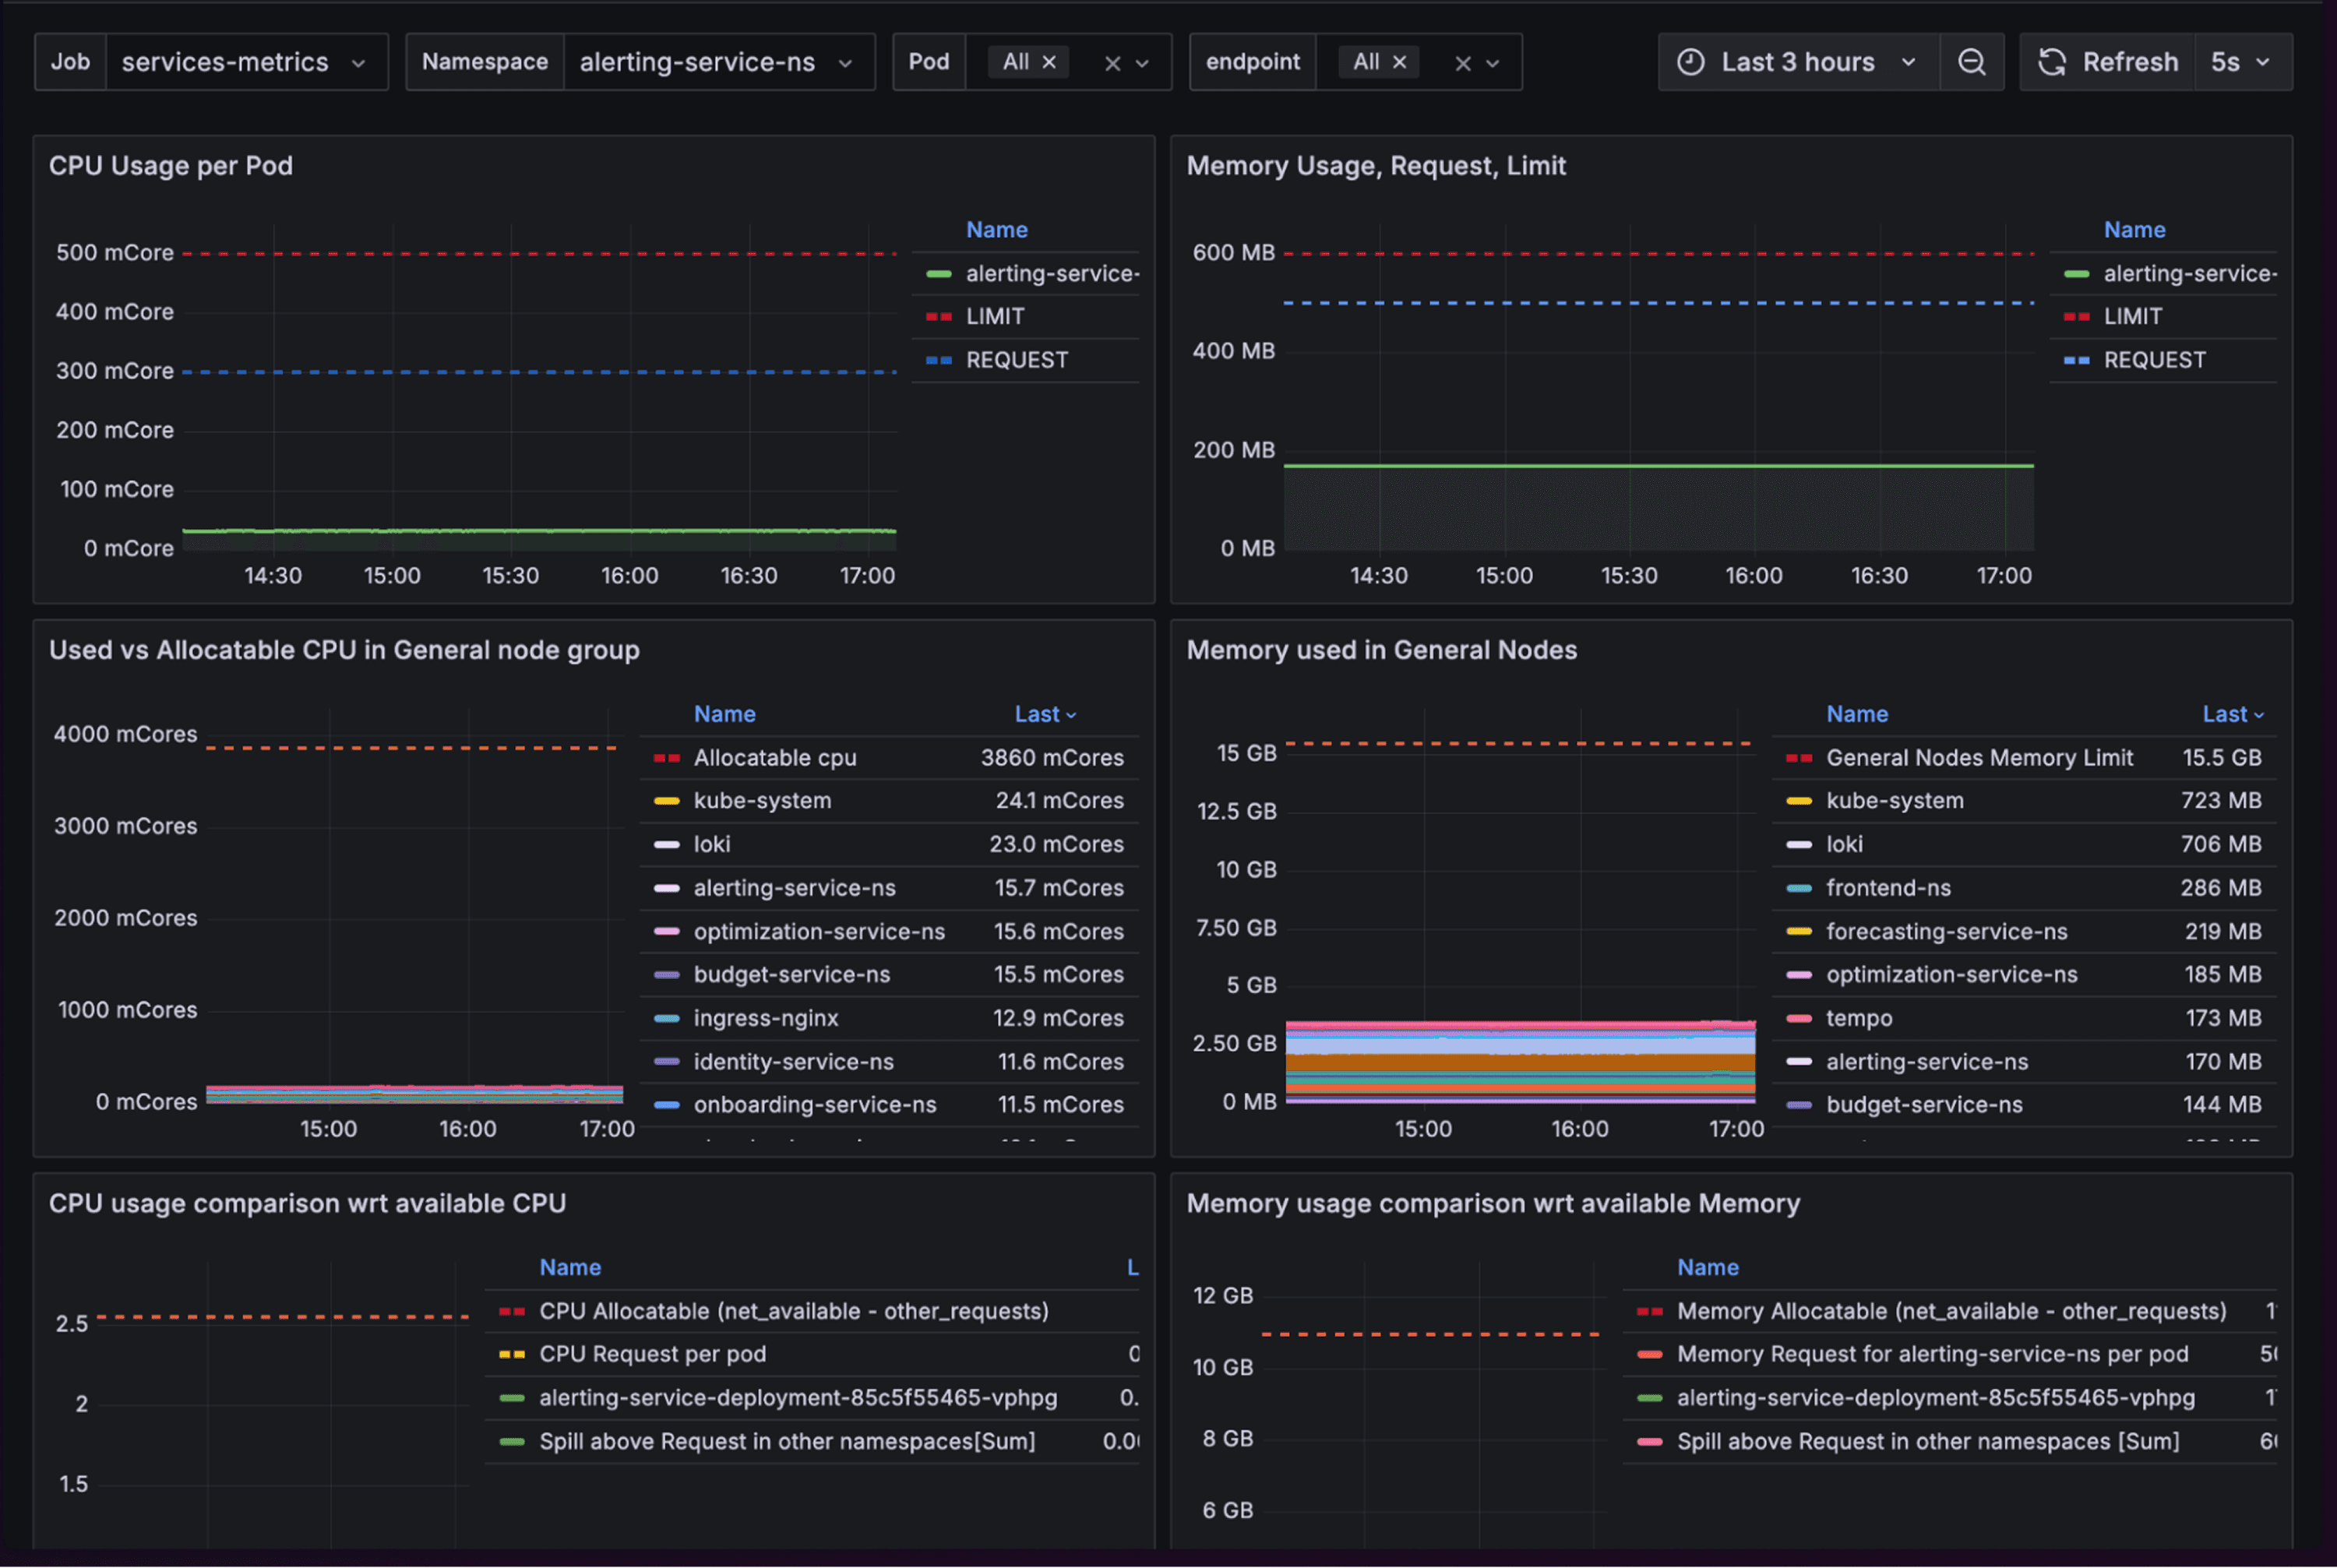
The Three Pillars of Observability Explained
Modern observability stands on three foundational data types. Together, they provide comprehensive system understanding.
Metrics are numerical measurements collected over time. Think CPU usage, request rates, error counts, and response times. They're compact, easily aggregated, and perfect for spotting trends. When your API response time jumps from 200ms to 2000ms, metrics catch it immediately.
But metrics only tell you that something happened, not why. They're the alerting mechanism that says "investigate now."
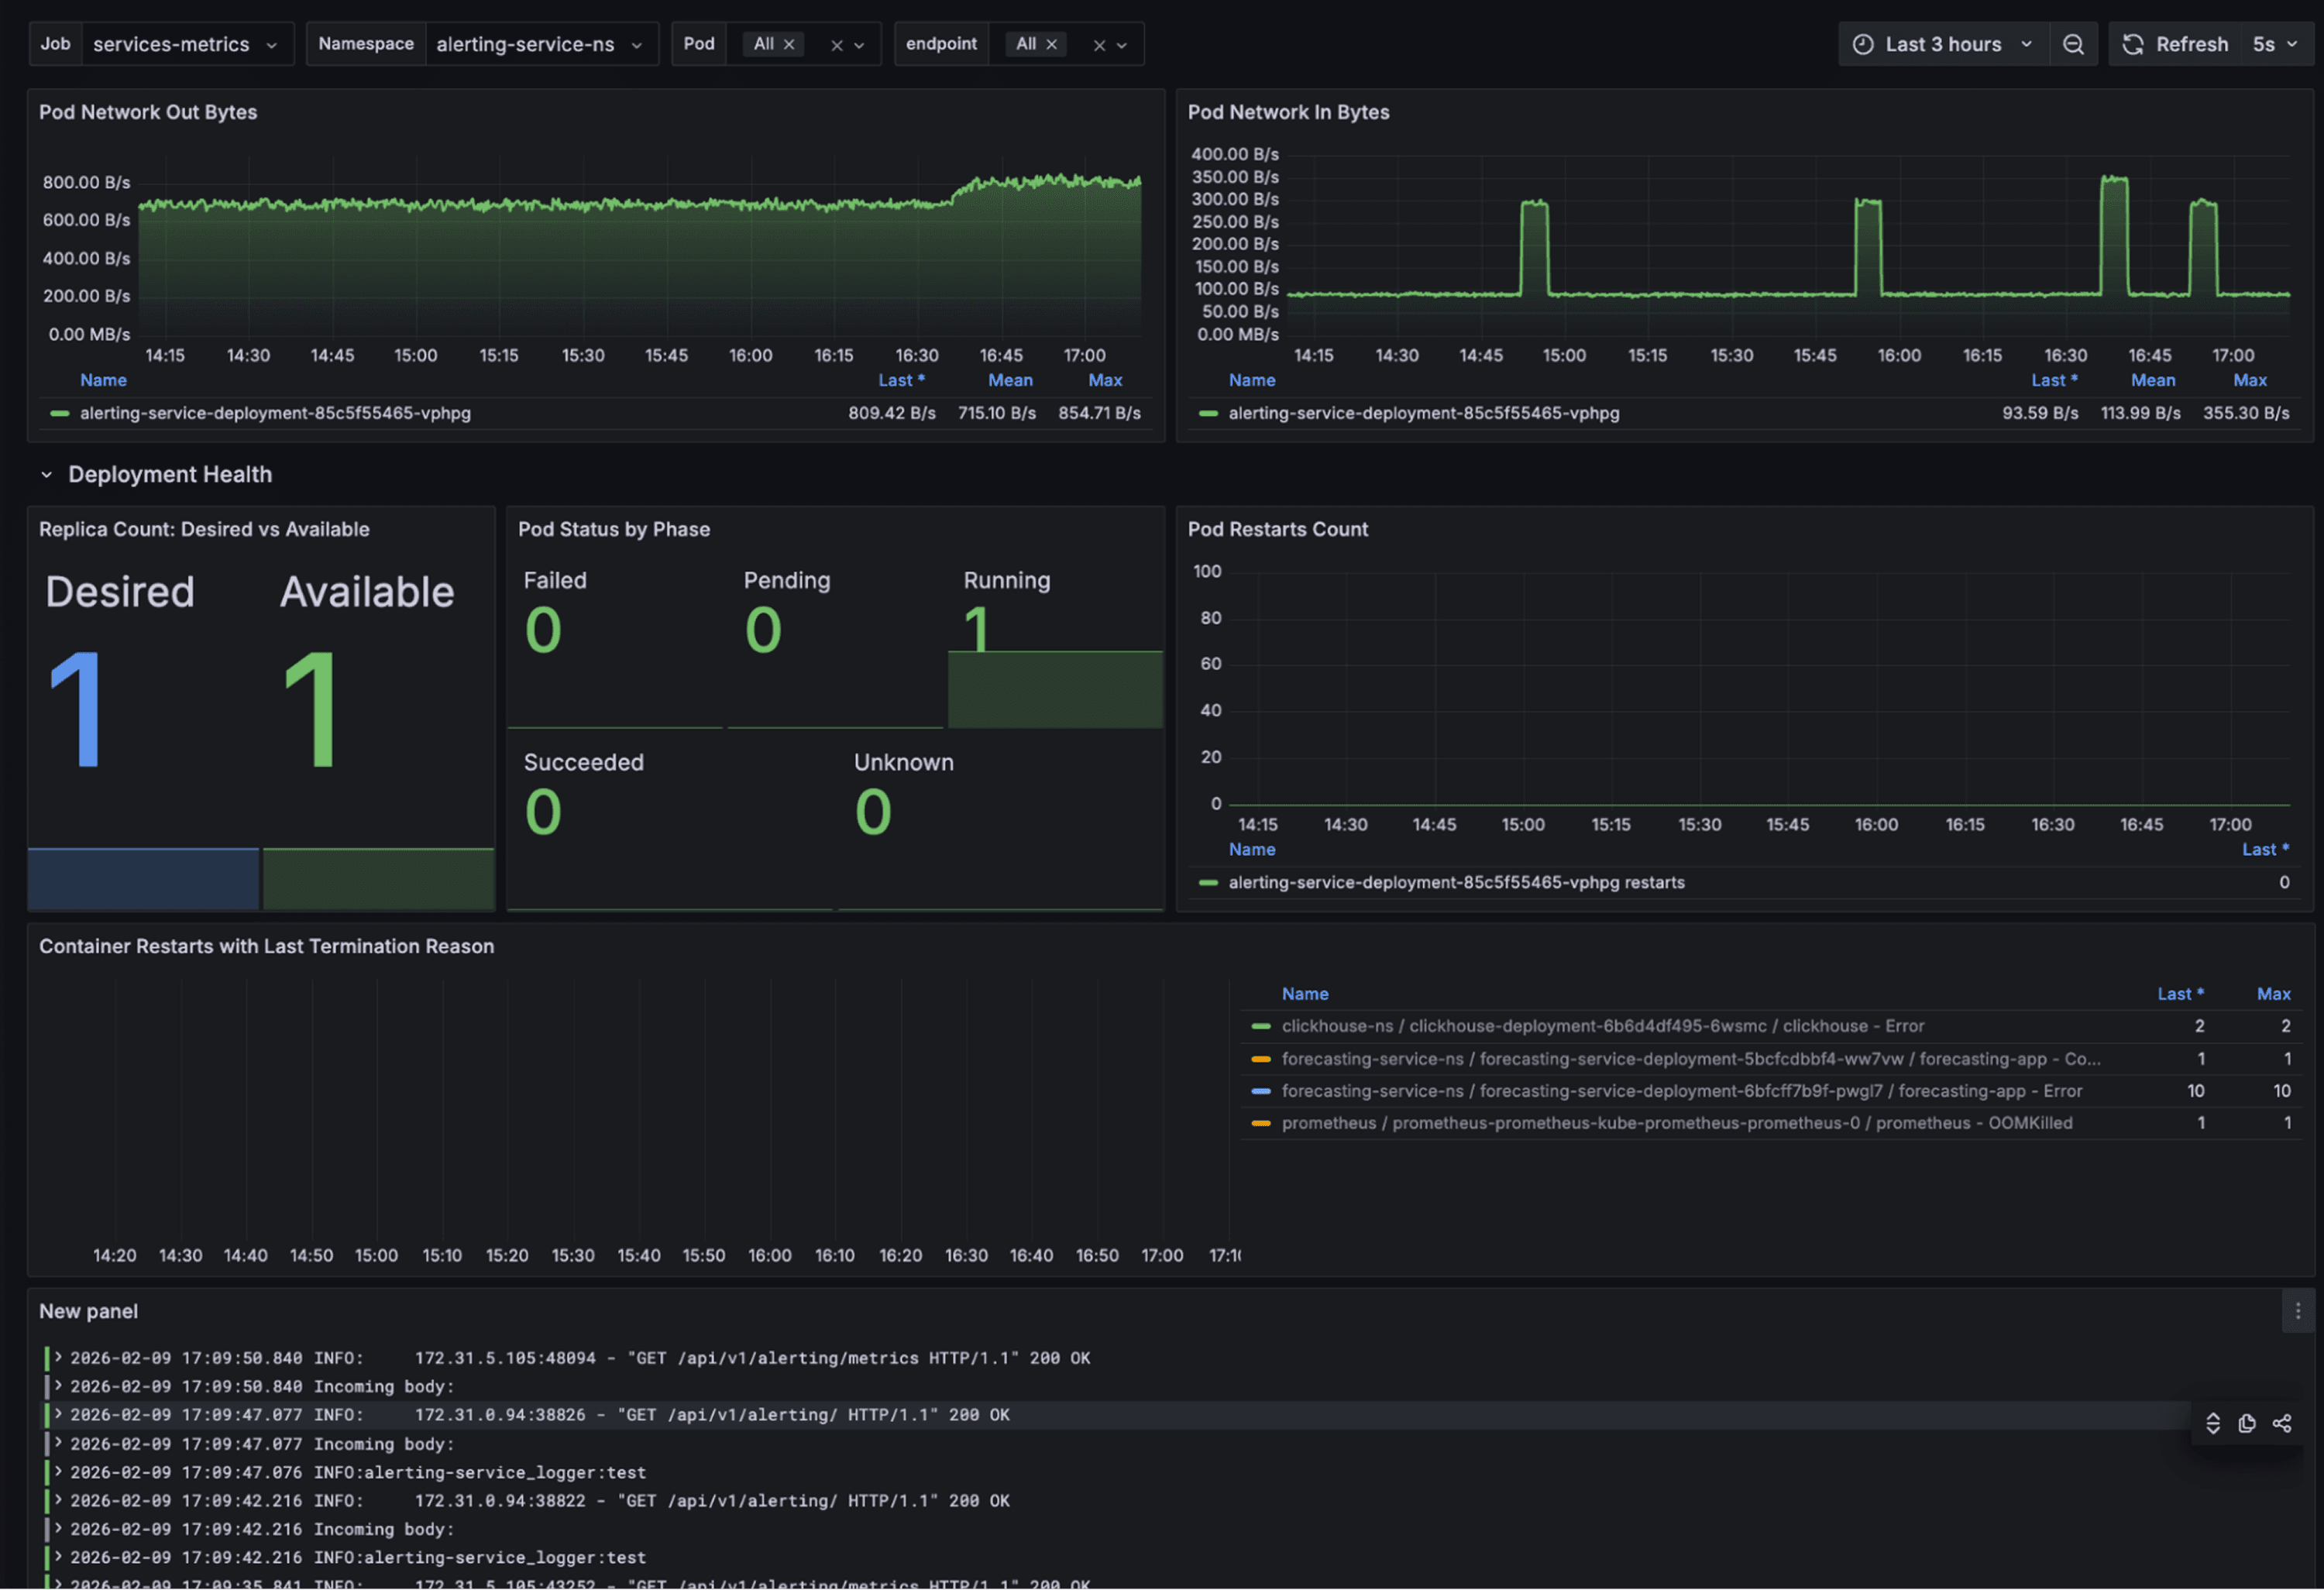
Logs are timestamped records of discrete events. Every application action generates a log entry. User login? Logged. Database query? Logged. Failed authentication attempt? Logged. These immutable records provide the contextual details metrics miss.
The challenge? Logs generate massive data volumes. A busy application produces gigabytes daily. Storing and searching them efficiently becomes a cost and performance challenge, especially as systems scale.
Traces follow individual requests through your distributed system. When a user clicks "checkout," distributed tracing maps that single action across every microservice it touches. You see exactly where time was spent, which service called which, and where failures occurred.
Traces reveal the connections logs and metrics can't show alone. They answer: "This request took 5 seconds. Where were those seconds spent?"
How the Pillars Work Together
Imagine your e-commerce site suddenly slows down. Metrics alert you that 95th percentile response times doubled. Traces show most delays happen in the recommendation service. Logs from that service reveal database connection timeouts. Now you know exactly what broke and why.
Without all three pillars working together, you'd still be guessing.
Monitoring: When It Works Best
Despite observability's advantages, monitoring remains valuable for specific scenarios. Understanding when monitoring suffices saves you from unnecessary complexity and cost.
Stable Infrastructure with predictable failure modes benefits most from monitoring. If you're running traditional three-tier applications on static server configurations, monitoring handles the job well. You know what can fail and how it fails.
Established Baselines make monitoring effective. When normal CPU usage ranges from 40-60%, alerting at 85% catches problems reliably. For systems with consistent behavior patterns, this approach works perfectly.
Compliance and Reporting often require monitoring. Security frameworks mandate tracking specific metrics over time. Monitoring excels at this structured data collection for audit trails and regulatory requirements.
Cost Consciousness sometimes favors monitoring. Full observability platforms can cost $800,000+ annually per vendor. If your needs are straightforward, monitoring provides sufficient visibility at lower cost.
The key question: Can you predict what might break? If yes, monitoring probably handles it. If no, you need observability.
Observability: When You Need Deeper Insights
The observability vs monitoring decision becomes clear when you examine your architecture. Certain scenarios demand the deeper investigation capabilities only observability provides.
Microservices Architectures practically require observability. When a single user action triggers 20+ service calls, each with its own dependencies, traditional monitoring can't map these interactions. You need distributed tracing to follow requests through the maze.
Cloud-Native Applications running on Kubernetes or serverless platforms benefit immensely from observability. These environments constantly change. Containers spin up and down. Services auto-scale. Monitoring predefined components becomes impossible when the components themselves are ephemeral.
Unknown Failures demand observability. When something breaks in a way you've never seen before, and your monitoring alerts provide no clues, observability tools let you explore the system's behavior without knowing exactly what question to ask first.
Multi-Cloud Deployments spanning AWS, Azure, and GCP create visibility challenges. Observability platforms unify telemetry data across providers, giving you a single pane of glass instead of juggling three separate monitoring dashboards.
Development Velocity increases with observability. Teams shipping changes multiple times daily need to quickly identify if new deployments caused problems. Observability enables rapid diagnosis and rollback decisions.
Research shows organizations with mature observability practices resolve incidents 40-60% faster than those relying on monitoring alone.
Key Trends Shaping Observability in 2026
The observability landscape is evolving rapidly. Several major trends are reshaping how organizations approach system visibility.
AI-Powered Predictive Capabilities are transforming observability from reactive to proactive. Instead of alerting after problems occur, AI analyzes historical patterns to predict failures before they impact users. Autonomous IT is becoming reality, with 96% of organizations maintaining or increasing observability budgets to support these capabilities.
OpenTelemetry Standardization is reaching critical mass. With 48.5% adoption and another 25% planning implementation, OpenTelemetry is becoming the default telemetry standard. Organizations report 50-72% cost reductions by switching from proprietary agents to OpenTelemetry instrumentation.
Tool Consolidation is accelerating. Currently, 74% of IT leaders would consolidate onto a single observability platform if it met their requirements. Running 2-5 separate platforms creates overlapping costs and integration overhead. Unified platforms enable the data correlation AI needs to function effectively.
Cost Optimization has become priority one. With median observability spend exceeding $800,000 annually, organizations are implementing intelligent sampling, data tiering, and observability budgets tied to business value. The "collect everything" mindset is financially unsustainable.
Agentic AI Integration is creating new observability challenges. As AI agents interact with other agents, the communication patterns become exponentially complex. Organizations adopting agentic AI without proper observability face escalating costs and unpredictable behavior.
Common Implementation Challenges and Solutions
Even with clear benefits, observability implementation hits obstacles. Here's how to address the most common challenges:
Challenge: Overwhelming Costs 84% of organizations struggle with unexpected observability expenses. Data volumes explode as you instrument more services, and vendor pricing scales linearly with ingestion.
Solution: Implement intelligent sampling that stores only meaningful deviations from baseline behavior. Use data tiering to push lower-priority logs to cost-effective archival storage. Tie telemetry collection directly to business value metrics.
Challenge: Data Overload Collecting everything generates terabytes daily. Teams drown in data without gaining insights.
Solution: Focus on actionable metrics tied to user experience and business outcomes. Start with critical user journeys, then expand coverage strategically. Use AI-powered tools to automatically surface anomalies instead of manual dashboard monitoring.
Challenge: Alert Fatigue Too many alerts train teams to ignore them. When everything is urgent, nothing is.
Solution: Tune alert thresholds based on historical data. Implement intelligent grouping that correlates related alerts. Use progressive alerting that escalates only if issues persist.
How Cloud Management Platforms Enhance Observability
While observability platforms excel at application and infrastructure visibility, comprehensive cloud management adds another crucial dimension. Modern organizations need unified views that connect performance monitoring with cost optimization and resource management.
Cloud management platforms complement observability by providing:
Unified Visibility Across Providers that monitors not just performance but also spending patterns. When observability alerts you to infrastructure issues, integrated cost visibility shows the financial impact immediately.
Resource Utilization Analysis that identifies over-provisioned and under-utilized resources. Your observability platform might show CPU sitting at 20%, but cloud management tools recommend right-sizing to cut costs by 40%.
Service Topology Mapping that visualizes dependencies across your entire cloud architecture. This complements application tracing by showing infrastructure relationships observability tools might miss.
Anomaly Detection for Spending catches unusual cost spikes that might indicate security issues or misconfigured services. When your observability platform reports increased traffic, anomaly detection reveals whether it's legitimate growth or a DDoS attack based on cost patterns.
Budget Guardrails that prevent runaway spending while maintaining necessary observability coverage. You can enforce spending limits by environment, team, or project without sacrificing visibility.
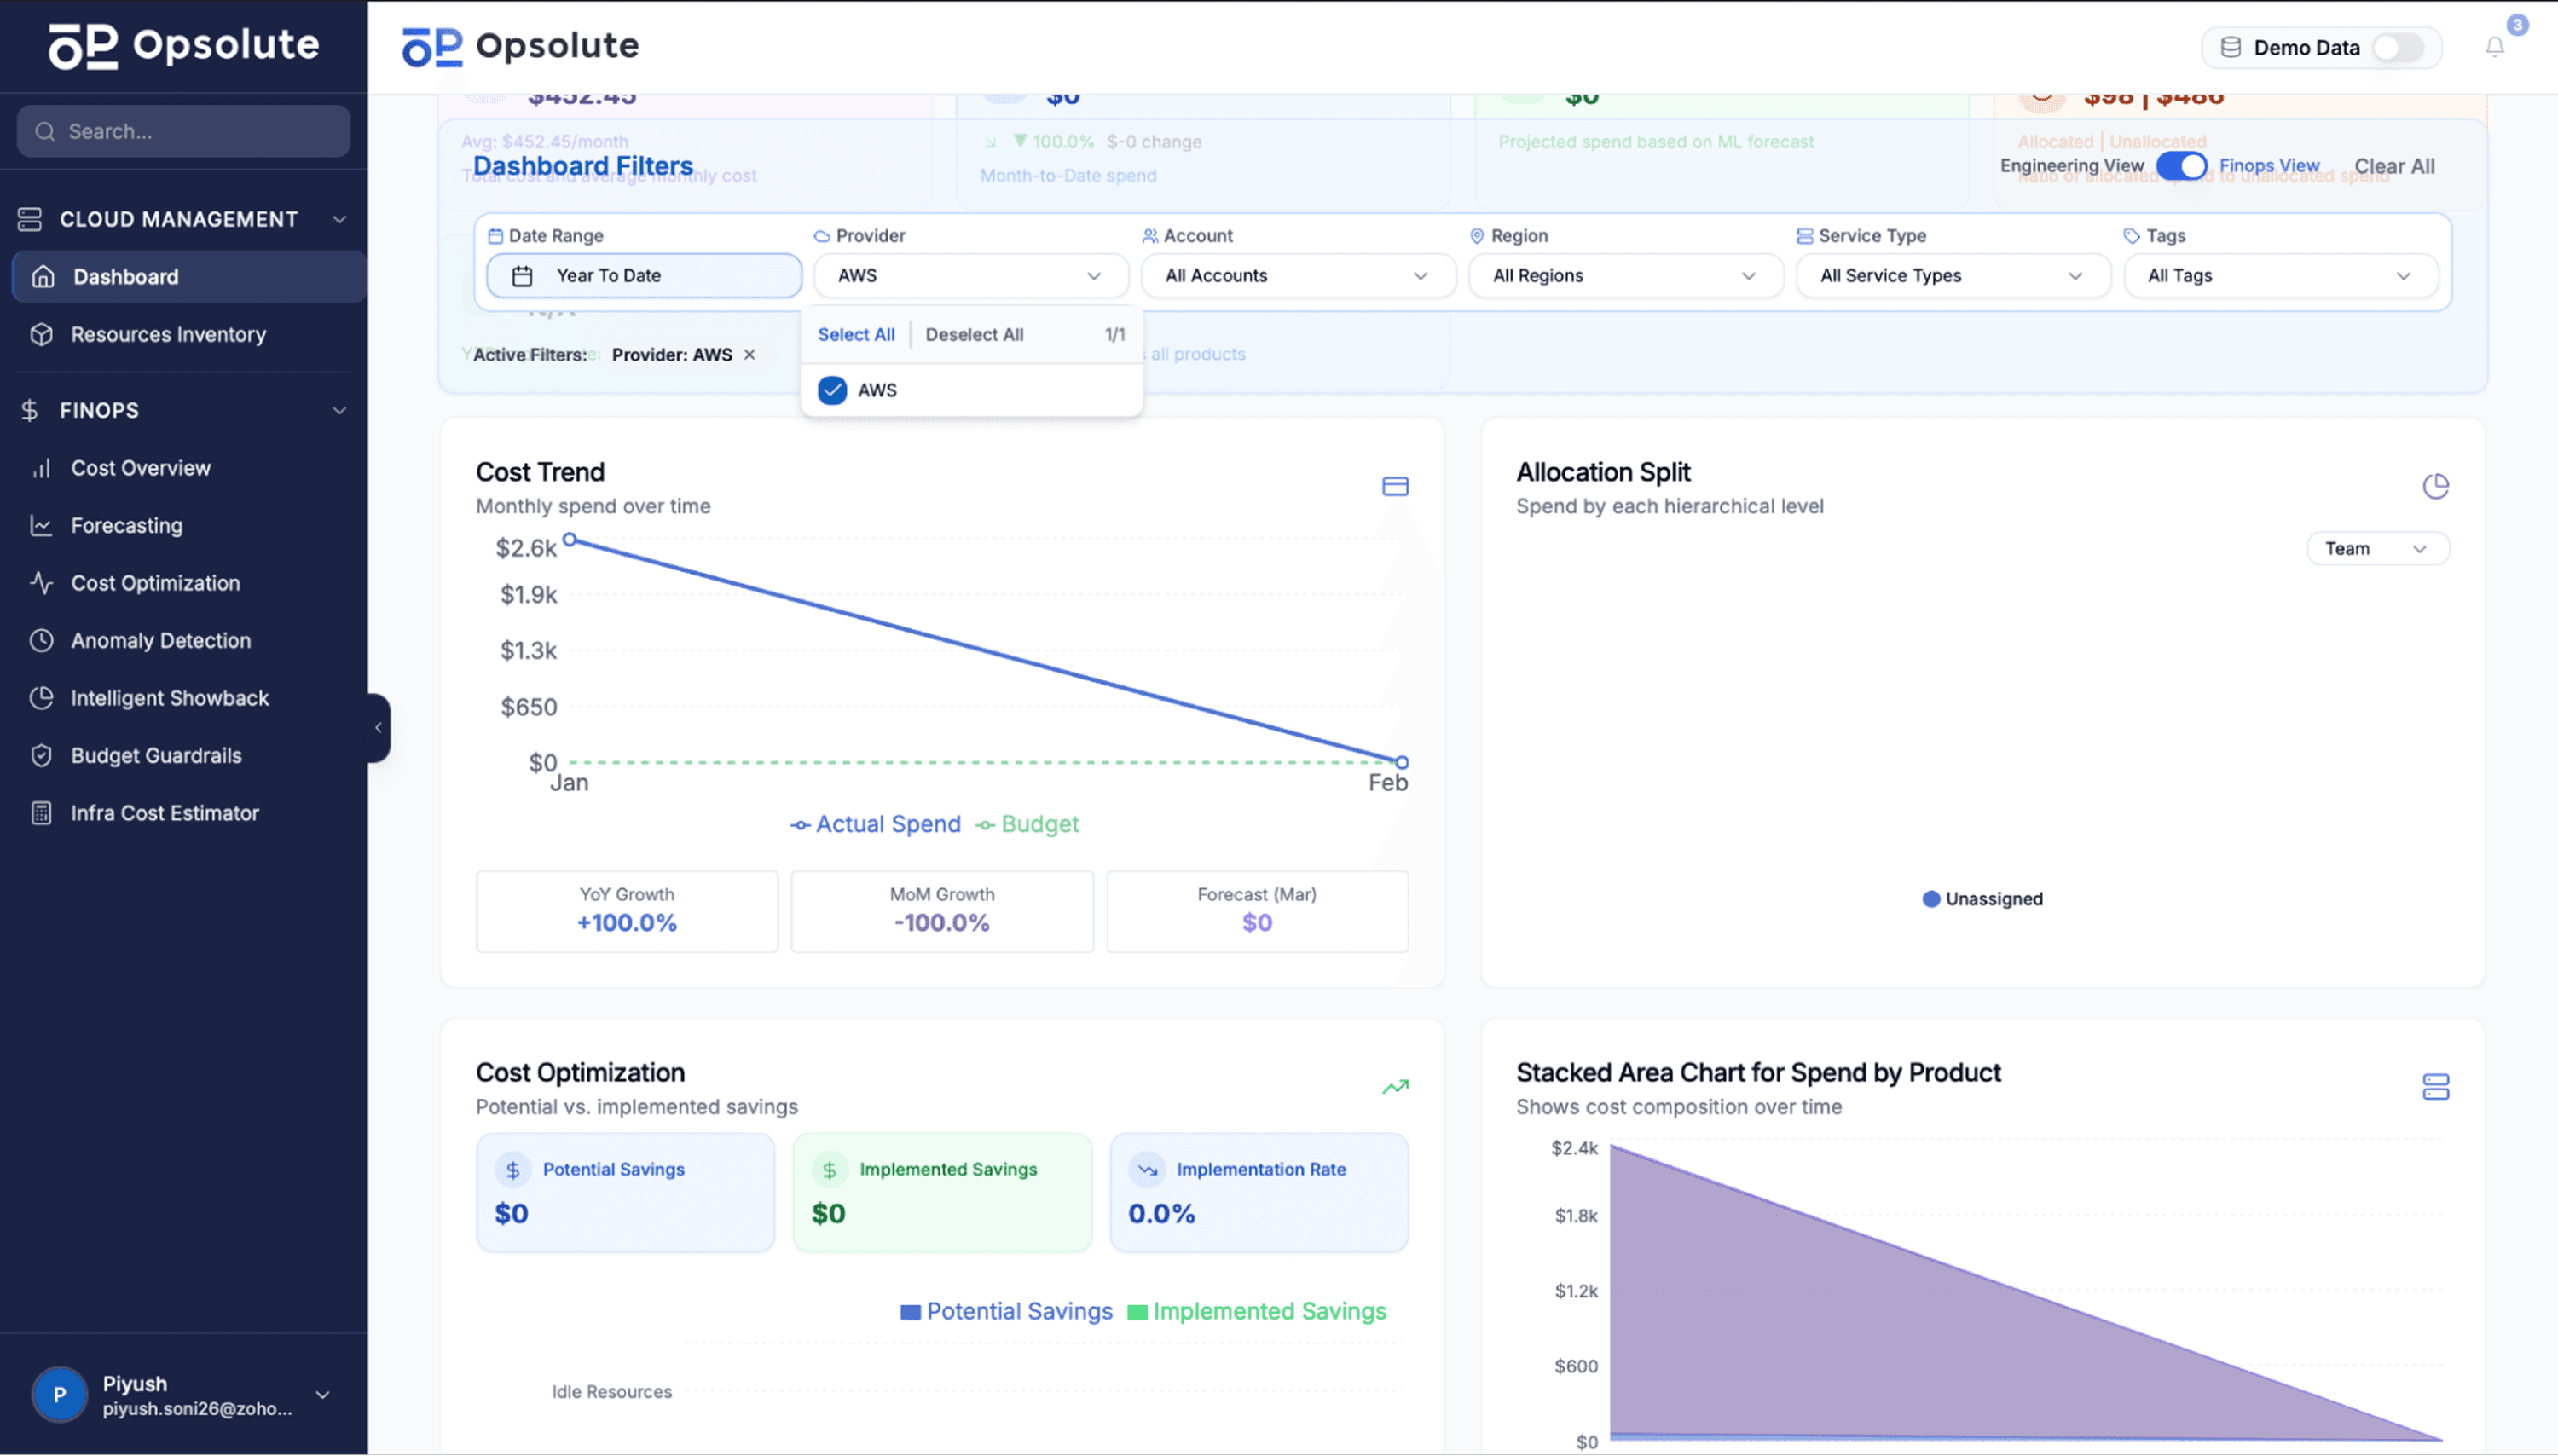
Platforms like Opsolute integrate these capabilities into a unified dashboard. Real-time visibility across AWS and GCP connects performance metrics with cost attribution. The heatmap feature analyzes utilization patterns to identify optimization opportunities, while service topology explorer provides architecture visualization that complements distributed tracing.
This integration becomes especially valuable when troubleshooting. Your observability platform identifies a performance issue. The cloud management dashboard immediately shows which team owns the affected resources, what it's costing, and whether similar resources are experiencing problems elsewhere in your infrastructure.
Moving Forward: Building Your Strategy
The observability vs monitoring decision isn't either/or. Most organizations need both, implemented thoughtfully based on their specific requirements.
Start by assessing your architecture complexity. Simple applications with predictable failures? Monitoring handles it. Microservices spanning multiple clouds? You need observability. Often, you'll use monitoring for stable components and observability for complex distributed systems.
Evaluate your current pain points. If you're constantly surprised by outages, observability fills your visibility gaps. If you just need compliance reporting, monitoring is sufficient. If incident resolution takes hours, observability's investigation tools justify the investment.
Consider your team's capabilities. Observability requires expertise in distributed systems, data analysis, and modern tooling. Factor in training costs and the learning curve. Sometimes, starting with enhanced monitoring and gradually adding observability components makes more sense than a complete platform replacement.
Budget realistically. Account for both tooling costs and operational investment. OpenTelemetry reduces vendor lock-in but requires internal expertise. Managed platforms cost more but reduce operational overhead. Find the balance that fits your organization's resources and skills.
Most importantly, tie everything to business outcomes. The best observability strategy improves customer experience, reduces downtime, and enables faster innovation. If your visibility investments don't drive these outcomes, reassess your approach.
Ready to unify your cloud visibility with cost optimization? Request a demo of Opsolute's cloud management platform to see how integrated observability and FinOps create complete operational intelligence across your infrastructure.
Stop guessing what your AWS bill will be next quarter.
Connect your AWS Organization in under 30 minutes. Most customers see their first chargeback report in 14 days and realize a 5–10× return on Opsolute within 90 days.
