Published by
Opsolute Team
on
Introduction
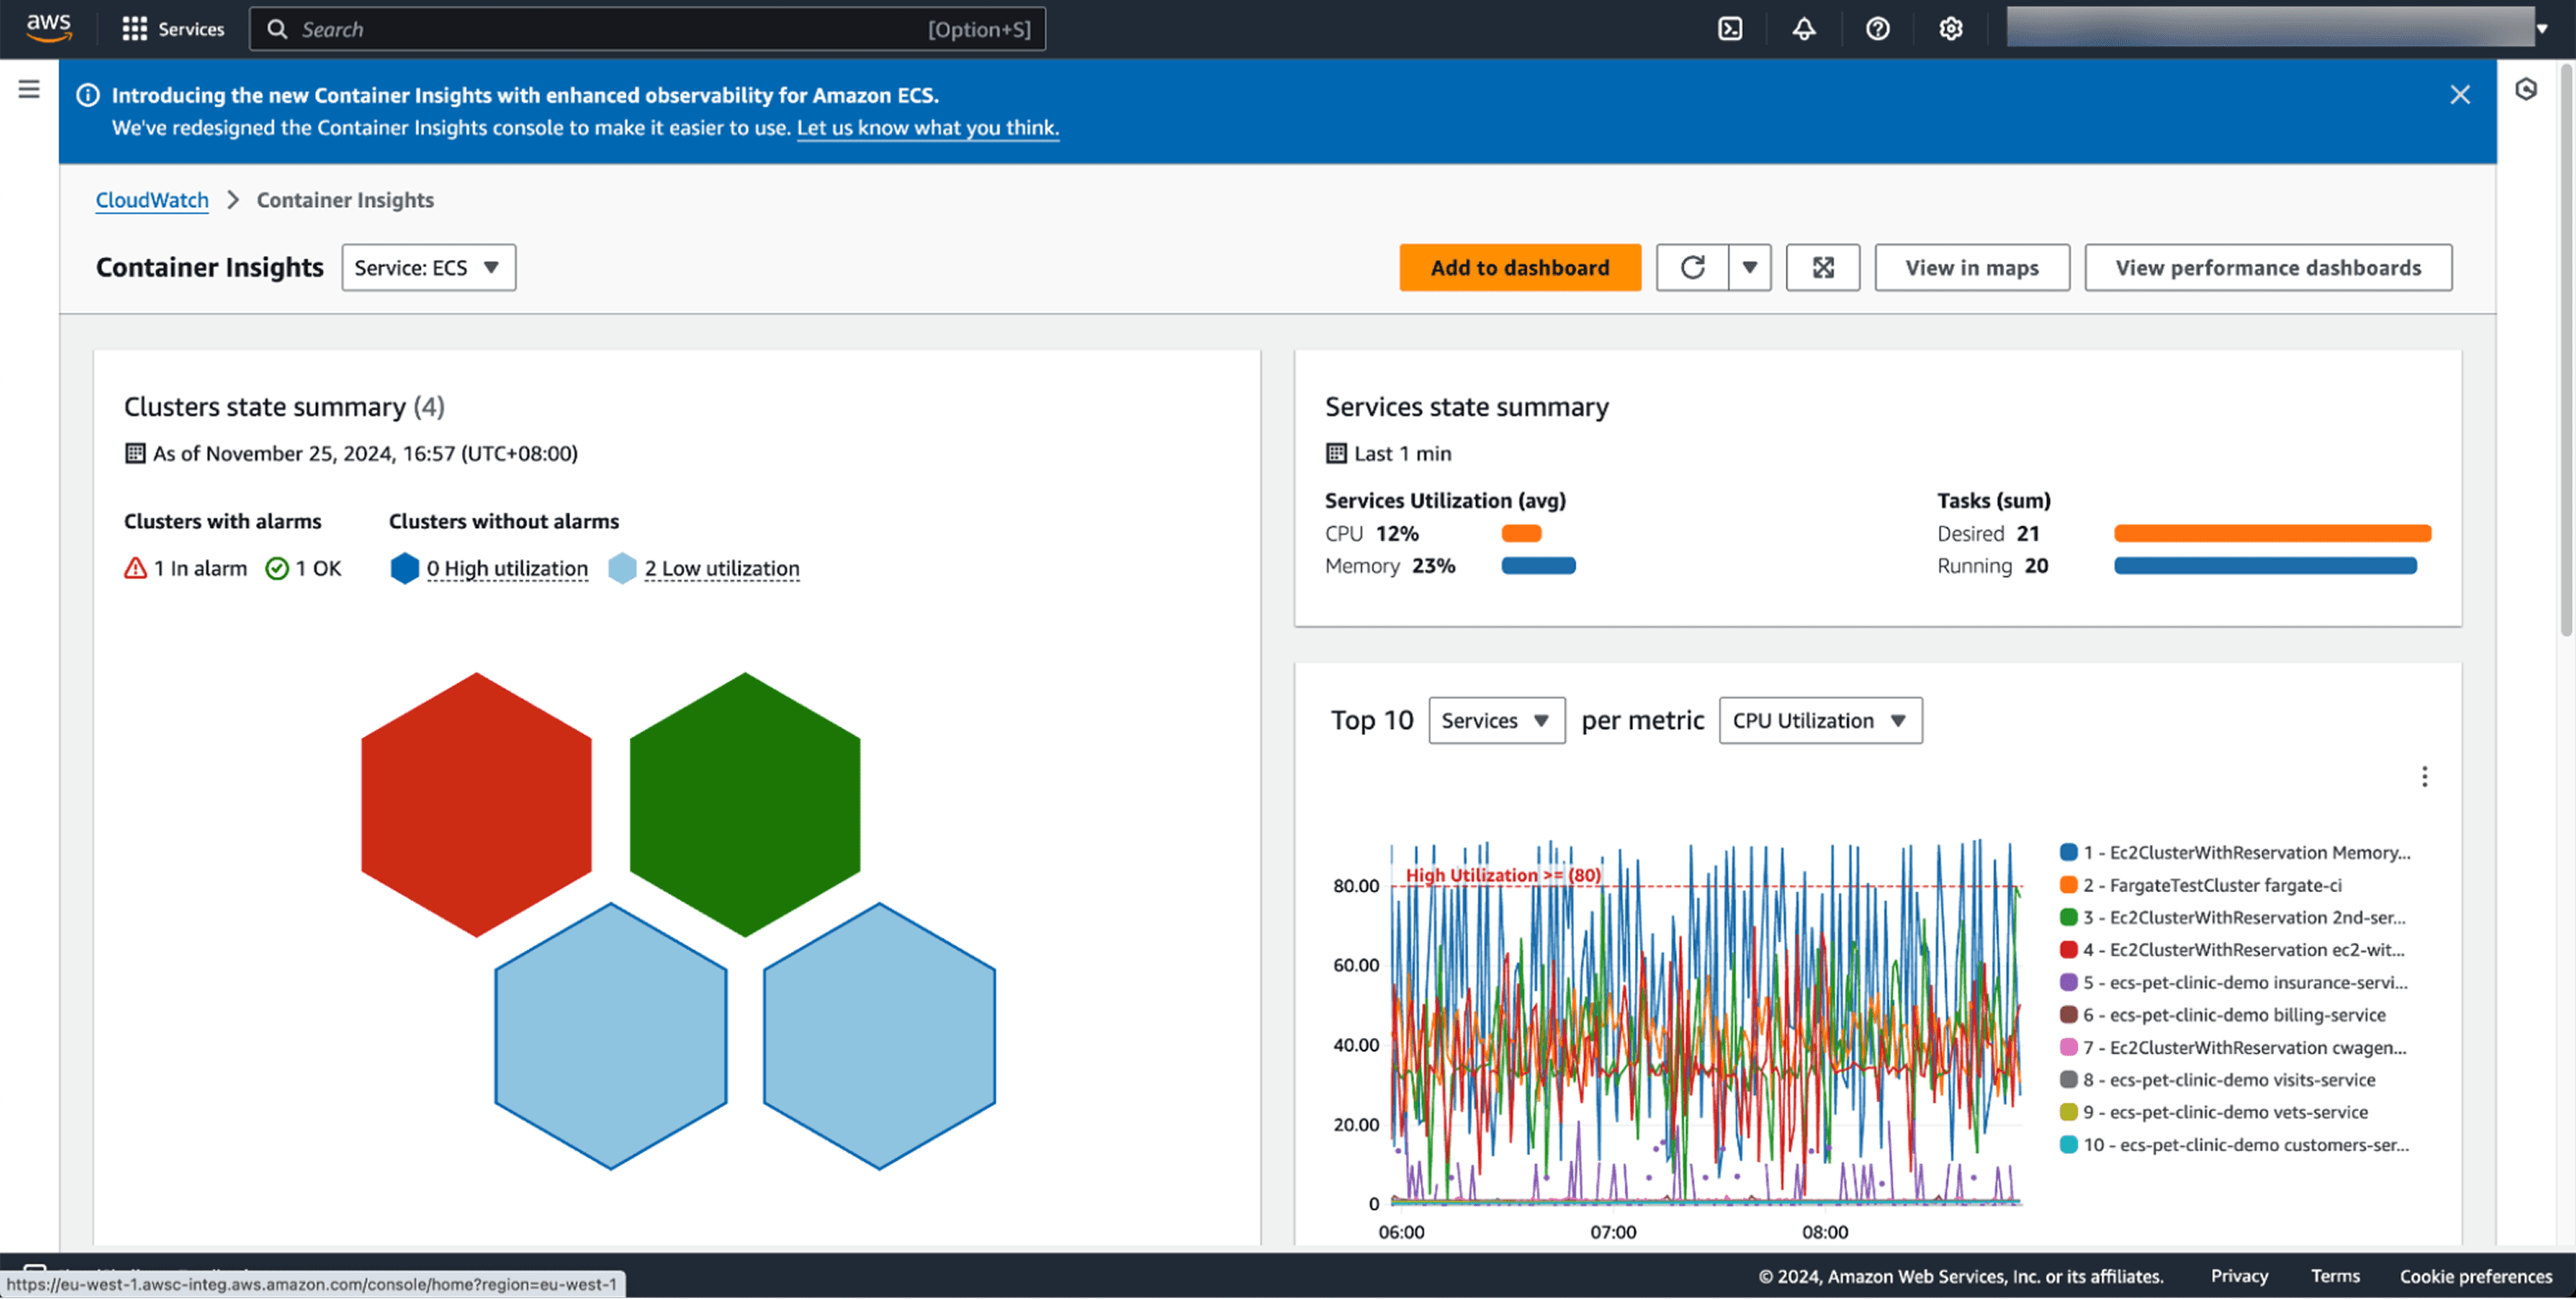
Managing containerized applications at scale requires deep visibility into every layer of your infrastructure. AWS Container Insights transforms CloudWatch into a powerful observability platform that automatically discovers containers, collects performance metrics at cluster, service, task, and container levels, and provides curated dashboards for rapid troubleshooting. With the recent launch of enhanced observability for Amazon ECS in December 2024, teams now have access to granular container-level metrics that reduce mean time to resolution by enabling visual drill-downs across container layers and AWS Tags.
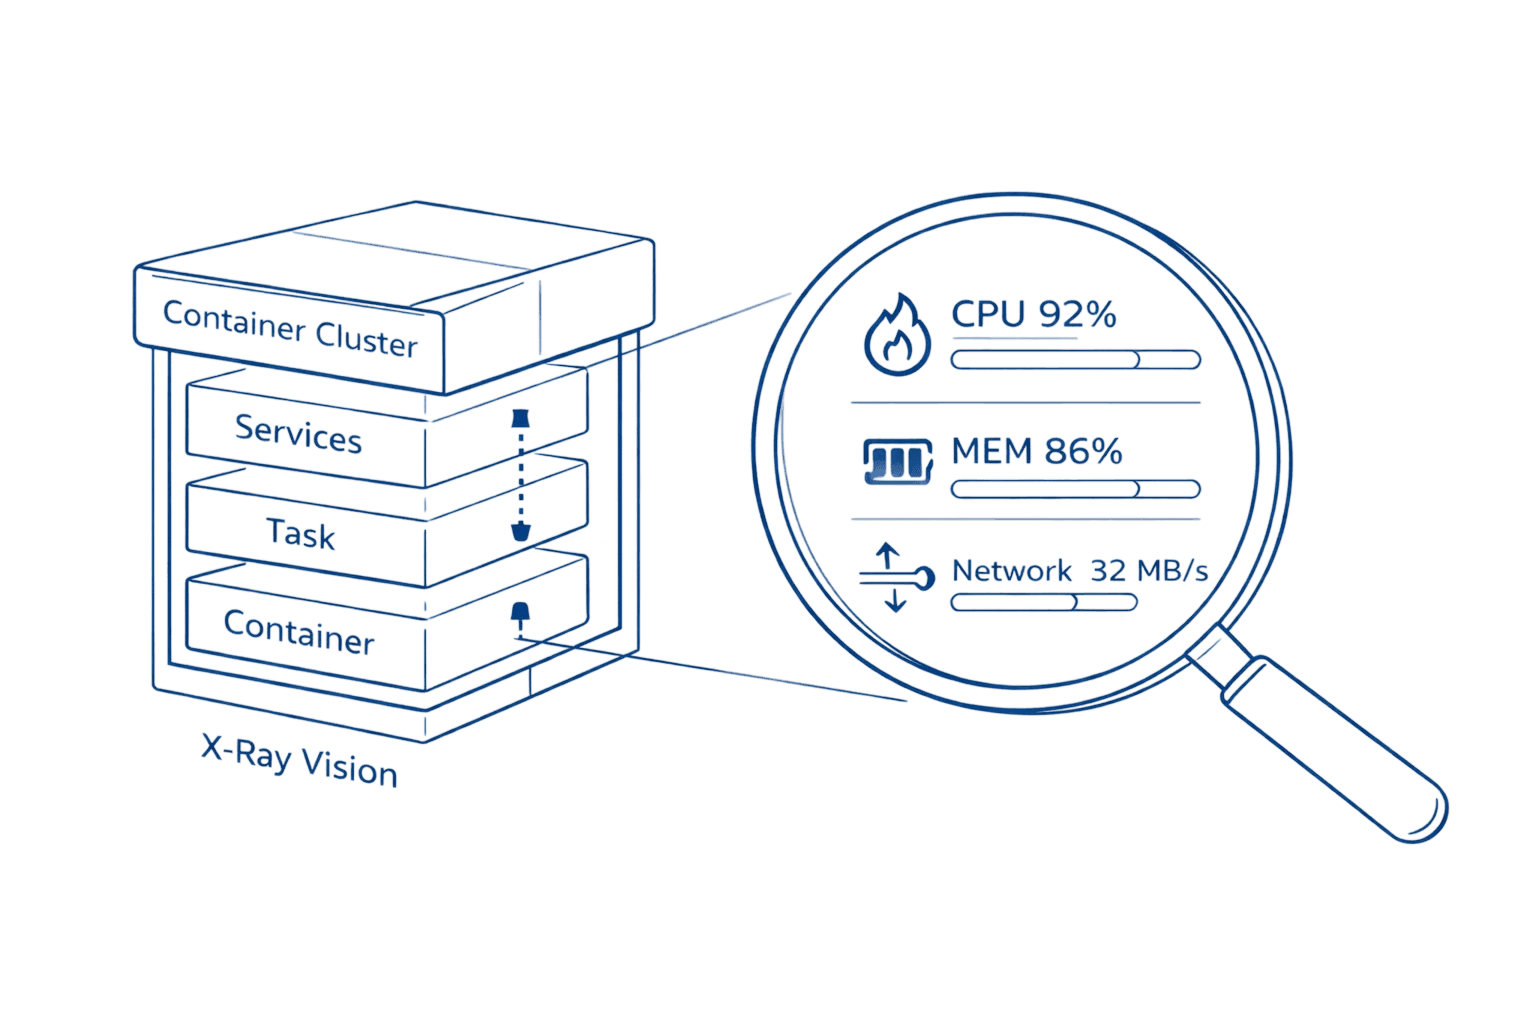
Default ECS and EKS metrics only show cluster-level data. You get CPU and memory percentages, but no visibility into which specific container is causing memory spikes. No way to correlate a service degradation with the container restart that triggered it. Container Insights fills this gap entirely, collecting performance data at every layer and storing it as structured logs you can query for deep analysis.
This guide walks you through everything you need to implement Container Insights effectively from choosing between standard and enhanced observability to optimizing costs using AWS Savings Plans while maintaining critical visibility.
Key Highlights
CloudWatch's Container Focus Container Insights is the specialized CloudWatch solution that automatically discovers and collects high-cardinality metrics for containers running on ECS, EKS, and Kubernetes on EC2.
Enhanced Visibility (2024) The December 2024 launch of Enhanced Observability for Amazon ECS delivers critical container-level metrics and visual drill-down capabilities previously unavailable, drastically reducing Mean Time To Resolution (MTTR).
Pricing Strategy Standard Container Insights uses per-metric pricing ($0.30 per metric), while Enhanced Observability uses observation-based pricing (pay-per-performance log event), which is often more cost-effective at scale.
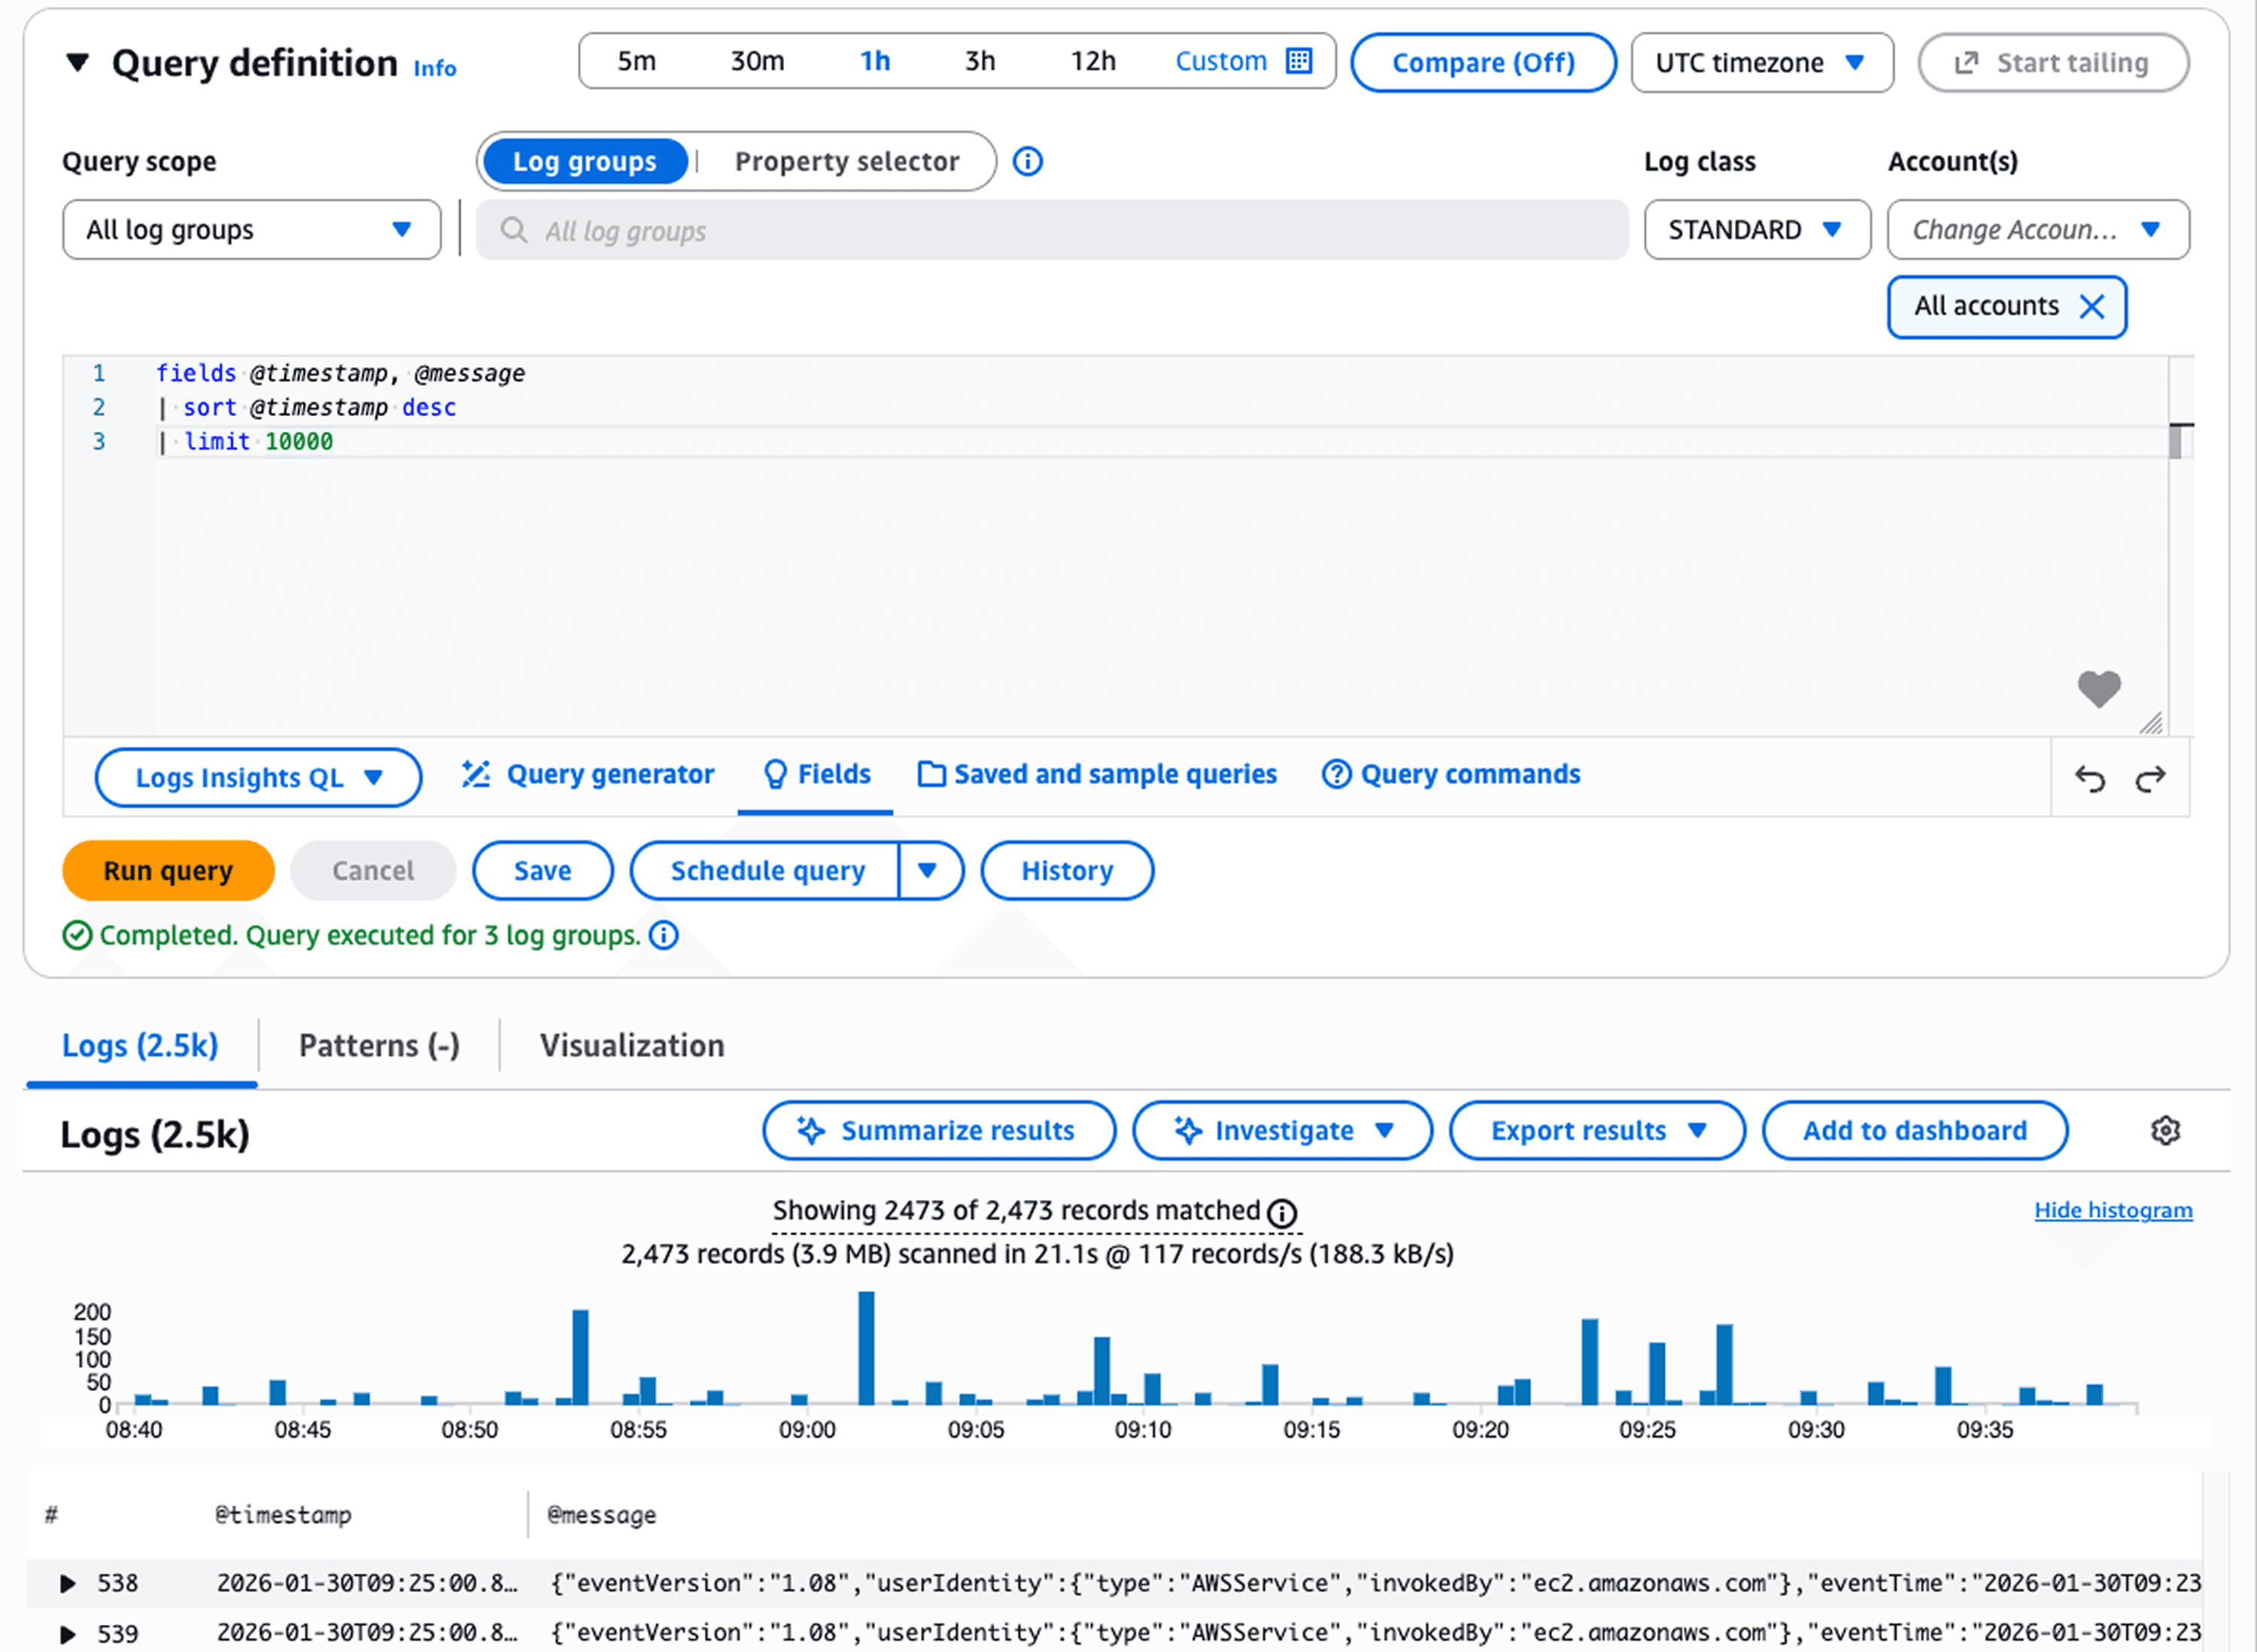
Observability Platform The solution collects and stores performance data as structured logs (Embedded Metric Format), enabling deep-dive analysis and correlation through CloudWatch Logs Insights.
Cost Optimization Costs can be reduced by 45–96% by strategically using the AWS Distro for OpenTelemetry (ADOT) collector to filter out unnecessary high-cardinality metrics and verbose application logs.
Understanding AWS Container Insights: What It Solves
Container Insights is CloudWatch's specialized monitoring solution that collects, aggregates, and visualizes metrics from containers running and improving AWS Cost Management. It works across Amazon ECS, Amazon EKS, Red Hat OpenShift on AWS, and self-managed Kubernetes on EC2 instances.
The core problem it solves: container environments are dynamic and ephemeral. Traditional monitoring approaches fail because containers spin up, scale, and terminate constantly. By the time you investigate an issue, the problematic container might no longer exist. Container Insights captures this data in real-time using embedded metric format, high-cardinality performance data stored as structured JSON logs that CloudWatch transforms into aggregated metrics.
For EKS environments, this is particularly valuable. EKS doesn't automatically publish metrics to CloudWatch. Without Container Insights, you have no native observability. With it enabled, you immediately see cluster, node, pod, and namespace-level metrics in automatic dashboards.
What you get:
Metric Category | Coverage |
Resource Utilization | CPU, memory, disk, network at every layer |
Container Health | Restart counts, state transitions, failure diagnostics |
Network Performance | Bytes transmitted/received, connection tracking |
Storage Metrics | Ephemeral storage usage (Fargate 1.4+) |
The data appears in CloudWatch automatic dashboards within 5-10 minutes of enablement. You can also query raw performance logs using CloudWatch Logs Insights for investigation that goes beyond standard metrics tracking down which specific container in a pod caused a memory leak, for example.
Standard vs Enhanced Observability: Choosing Your Level
AWS offers two versions of Container Insights. Understanding the difference impacts both your visibility and your costs.
Standard Container Insights collects cluster, service, and task-level metrics. It charges as custom CloudWatch metrics at $0.30 per metric. A single ECS cluster with one service and one task generates 16 custom metrics ($4.80/month). An EKS cluster with one namespace, node, and pod creates 25 metrics ($7.50/month).
Enhanced observability extends this with container-level metrics, Kubernetes control plane data (API server latency, etcd performance), Kube-state metrics showing cluster health, and visual drill-down capabilities. Instead of per-metric charges, it uses observation-based pricing you pay per observation rather than per metric stored, which proves more cost-effective for larger deployments.
The enhanced version launched for ECS in December 2024. It provides task and container-level visibility that wasn't previously available, letting you drill from cluster anomalies down to specific containers causing issues. For EKS, enhanced observability added accelerated compute metrics for GPU workloads (Trainium, Inferentia, NVIDIA GPUs) and Windows container support in April 2024.
AWS recommends enhanced observability for production environments. Teams see 60-70% faster problem resolution through better correlation of metrics, logs, and events. The typical cost difference? Monitoring a cluster with 10 nodes, 20 pods, and 20 containers runs approximately $96/month in metrics plus $5.73 in logs with enhanced observability $101.73 total.
[DIAGRAM NEEDED: Decision flowchart showing "Standard vs Enhanced" choice based on environment type (production vs non-production), cluster size, and need for container-level visibility]
For non-production environments where budget constraints outweigh granular visibility needs, standard Container Insights works. For everything else, enhanced observability delivers better ROI through faster incident resolution.
Setting Up Container Insights: The Fast Path
Configuration varies by platform but follows similar patterns. Here's the fastest path for each.
For Amazon ECS:
Enable at account level to automatically activate Container Insights for all new clusters:
aws ecs put-account-setting \ |
This sets enhanced observability as default. All new clusters inherit this setting. For existing clusters, update individually:
aws ecs update-cluster-settings \ |
Metrics appear in CloudWatch Console under Container Insights within 10 minutes. The service begins learning baseline patterns immediately but needs 24 hours before anomaly detection becomes accurate.
For Amazon EKS:
The easiest approach uses the CloudWatch Observability EKS add-on. First, attach the required policy to your worker node IAM role:
aws iam attach-role-policy \ |
Then install the add-on:
aws eks create-addon \ |
The add-on deploys CloudWatch agent as a DaemonSet and configures FluentBit for log collection. Enhanced observability activates automatically. You'll see metrics populate within 15 minutes.
Critical setup note: For ECS on EC2 instances, you need Amazon ECS agent version 1.29 or later. For EKS, the add-on handles everything. Network metrics work with bridge and awsvpc network modes but not host mode.
Key Metrics That Matter
Container Insights collects comprehensive metrics, but certain ones drive the most troubleshooting value.
CPU and Memory Utilization: Shows percentage used versus reserved at cluster, service, task, and container levels. The container-level breakdown (enhanced observability only) lets you identify which specific container in a multi-container pod is consuming resources.
Task State Transitions: Tracks tasks moving between pending, running, and stopped states. Sudden spikes in stopped tasks indicate deployment failures or resource constraints killing containers.
Restart Counts: Container restart patterns reveal unstable applications. One container restarting 47 times in an hour points to a crash loop from misconfiguration or resource limits.
Network Metrics: Bytes transmitted and received help identify traffic spikes. When your normally quiet batch processing cluster suddenly transmits 50GB/hour, you've found your cost anomaly source.
Ephemeral Storage: For Fargate tasks on platform version 1.4+, shows storage usage. Critical for workloads writing logs or temporary files to container filesystem.
The real power comes from correlation. When enhanced observability shows CPU spiking on cluster → drill to service → drill to task → drill to specific container, you've gone from "something's wrong" to "container-A in task-XYZ is the culprit" in under 60 seconds.
Cost Optimization: Controlling Container Insights Expenses
Container Insights costs scale with cluster complexity. Organizations monitoring dozens of clusters with hundreds of pods see significant monthly charges. The good news: you can reduce costs 45-96% through strategic filtering.
AWS Distro for OpenTelemetry (ADOT) enables metric customization. Instead of collecting all available metrics, configure the ADOT collector to send only what you need. Most teams need CPU, memory, pod counts, and node health. Container filesystem metrics, detailed network stats per pod, and disk I/O often add cost without adding value.
Start with production environments using full enhanced observability. For development and staging, reduce granularity. One case study: a cluster with 500 pods reduced monthly costs from $172.55 to $94.11 (45% savings) by filtering unnecessary metrics while maintaining critical visibility.
Application log filtering delivers even bigger wins. Container Insights adds 700 bytes of metadata per log line for filtering capability. If you're ingesting verbose application logs, costs balloon quickly. One organization reduced application log costs from $450/month to $15/month (96.5% savings) by filtering debug logs and focusing on errors and performance issues.
CloudWatch Logs storage costs $0.50 per GB ingested plus $0.03 per GB monthly storage. For a cluster generating 100GB of logs monthly, that's $50 ingestion plus $3 storage, $53 just for logs. Filter aggressively.
The strategic approach:
Enable enhanced observability for production clusters
Use standard Container Insights for non-production
Filter metrics by disabling high-cardinality dimensions (PodName, specific service names)
Reduce log verbosity to errors and warnings
Use CloudWatch Logs Insights for deep investigation instead of creating all possible custom metrics
You maintain critical visibility while controlling costs. The key is matching observability level to environment criticality.
Real-World Use Cases: Where Container Insights Delivers Value
Memory Leak Detection: A SaaS company noticed gradual performance degradation over several days. Container Insights container-level metrics showed memory usage climbing steadily in one specific container within their authentication service. They identified a connection pooling bug that would have taken weeks to find through traditional logging.
Deployment Validation: During a blue-green deployment, task state transition metrics showed 40% of new tasks entering stopped state within 2 minutes of launch. The team caught a misconfigured health check before routing production traffic to the broken deployment. Without Container Insights, they would have discovered this during the traffic cutover after user impact.
Capacity Planning: An analytics platform used cluster and service-level statistics to determine resource requirements. By analyzing typical CPU and memory patterns across a month, they right-sized instance types and reduced over-provisioning by 30%, saving $12K monthly while maintaining performance headroom for spikes.
Cost Attribution: Network metrics revealed one microservice transmitting 200GB daily to an external logging service. The team hadn't realized debug logging was still enabled in production. Disabling it saved $1,800/month in data transfer costs.
The visual drill-down capabilities make these discoveries fast. Start at cluster-level anomaly, narrow to problematic service, pinpoint exact container. What used to take hours of log analysis now takes minutes.
FAQ: Container Insights Essentials
Q: What's the difference between Container Insights and regular CloudWatch metrics for ECS/EKS?
A: Regular CloudWatch provides basic cluster-level metrics like overall CPU and memory utilization. Container Insights extends this with task-level, service-level, and container-level metrics, network performance data, diagnostic information like container restart failures, and automatic dashboards. It also provides structured performance logs that enable deep-dive analysis through CloudWatch Logs Insights.
Q: Can I use Container Insights with Fargate?
A: Yes, Container Insights fully supports AWS Fargate for both Amazon ECS and Amazon EKS deployments. Enhanced observability for ECS works on Fargate. For EKS on Fargate, you must use AWS Distro for OpenTelemetry to enable monitoring.
Q: How do I reduce Container Insights costs without losing critical visibility?
A: Use AWS Distro for OpenTelemetry to customize which metrics are collected, filter out unnecessary dimensions in non-production environments, reduce log verbosity while maintaining error and performance logs, and leverage CloudWatch Logs Insights for detailed analysis instead of creating all possible custom metrics. Organizations typically achieve 45-96% cost reduction through strategic filtering.
Q: Should I choose standard Container Insights or enhanced observability?
A: AWS recommends enhanced observability for production environments. It provides container-level visibility, reduces mean time to resolution through visual drill-downs, and often costs less at scale due to observation-based pricing versus per-metric charges. Use standard Container Insights only for non-production environments where budget constraints outweigh granular visibility needs.
Take Action: Implement Container Insights Today
Container Insights transforms container monitoring from reactive firefighting to proactive management. You catch issues before users notice them. You identify cost anomalies before month-end billing. You troubleshoot faster because you see exactly which container caused the problem.
Start here:
Enable enhanced observability on one production cluster today. Watch the automatic dashboards populate within 15 minutes. Set up your first CloudWatch alarm on container restart counts or CPU thresholds. Experience the drill-down capability during your next incident.
For cost-conscious teams, begin with enhanced observability on production and standard on non-production. Monitor your CloudWatch bill for 30 days, then optimize using ADOT metric filtering if needed.
The investment pays for itself through faster incident resolution. When your mean time to resolution drops from 2 hours to 20 minutes because you can pinpoint problematic containers immediately, the ROI becomes obvious.
Schedule a cloud cost optimization consultation to analyze your Container Insights spending and identify opportunities to reduce monitoring costs while improving observability. We'll review your current setup, benchmark against similar workloads, and build a customized optimization plan that maintains critical visibility while controlling expenses.
Stop guessing what your AWS bill will be next quarter.
Connect your AWS Organization in under 30 minutes. Most customers see their first chargeback report in 14 days and realize a 5–10× return on Opsolute within 90 days.
