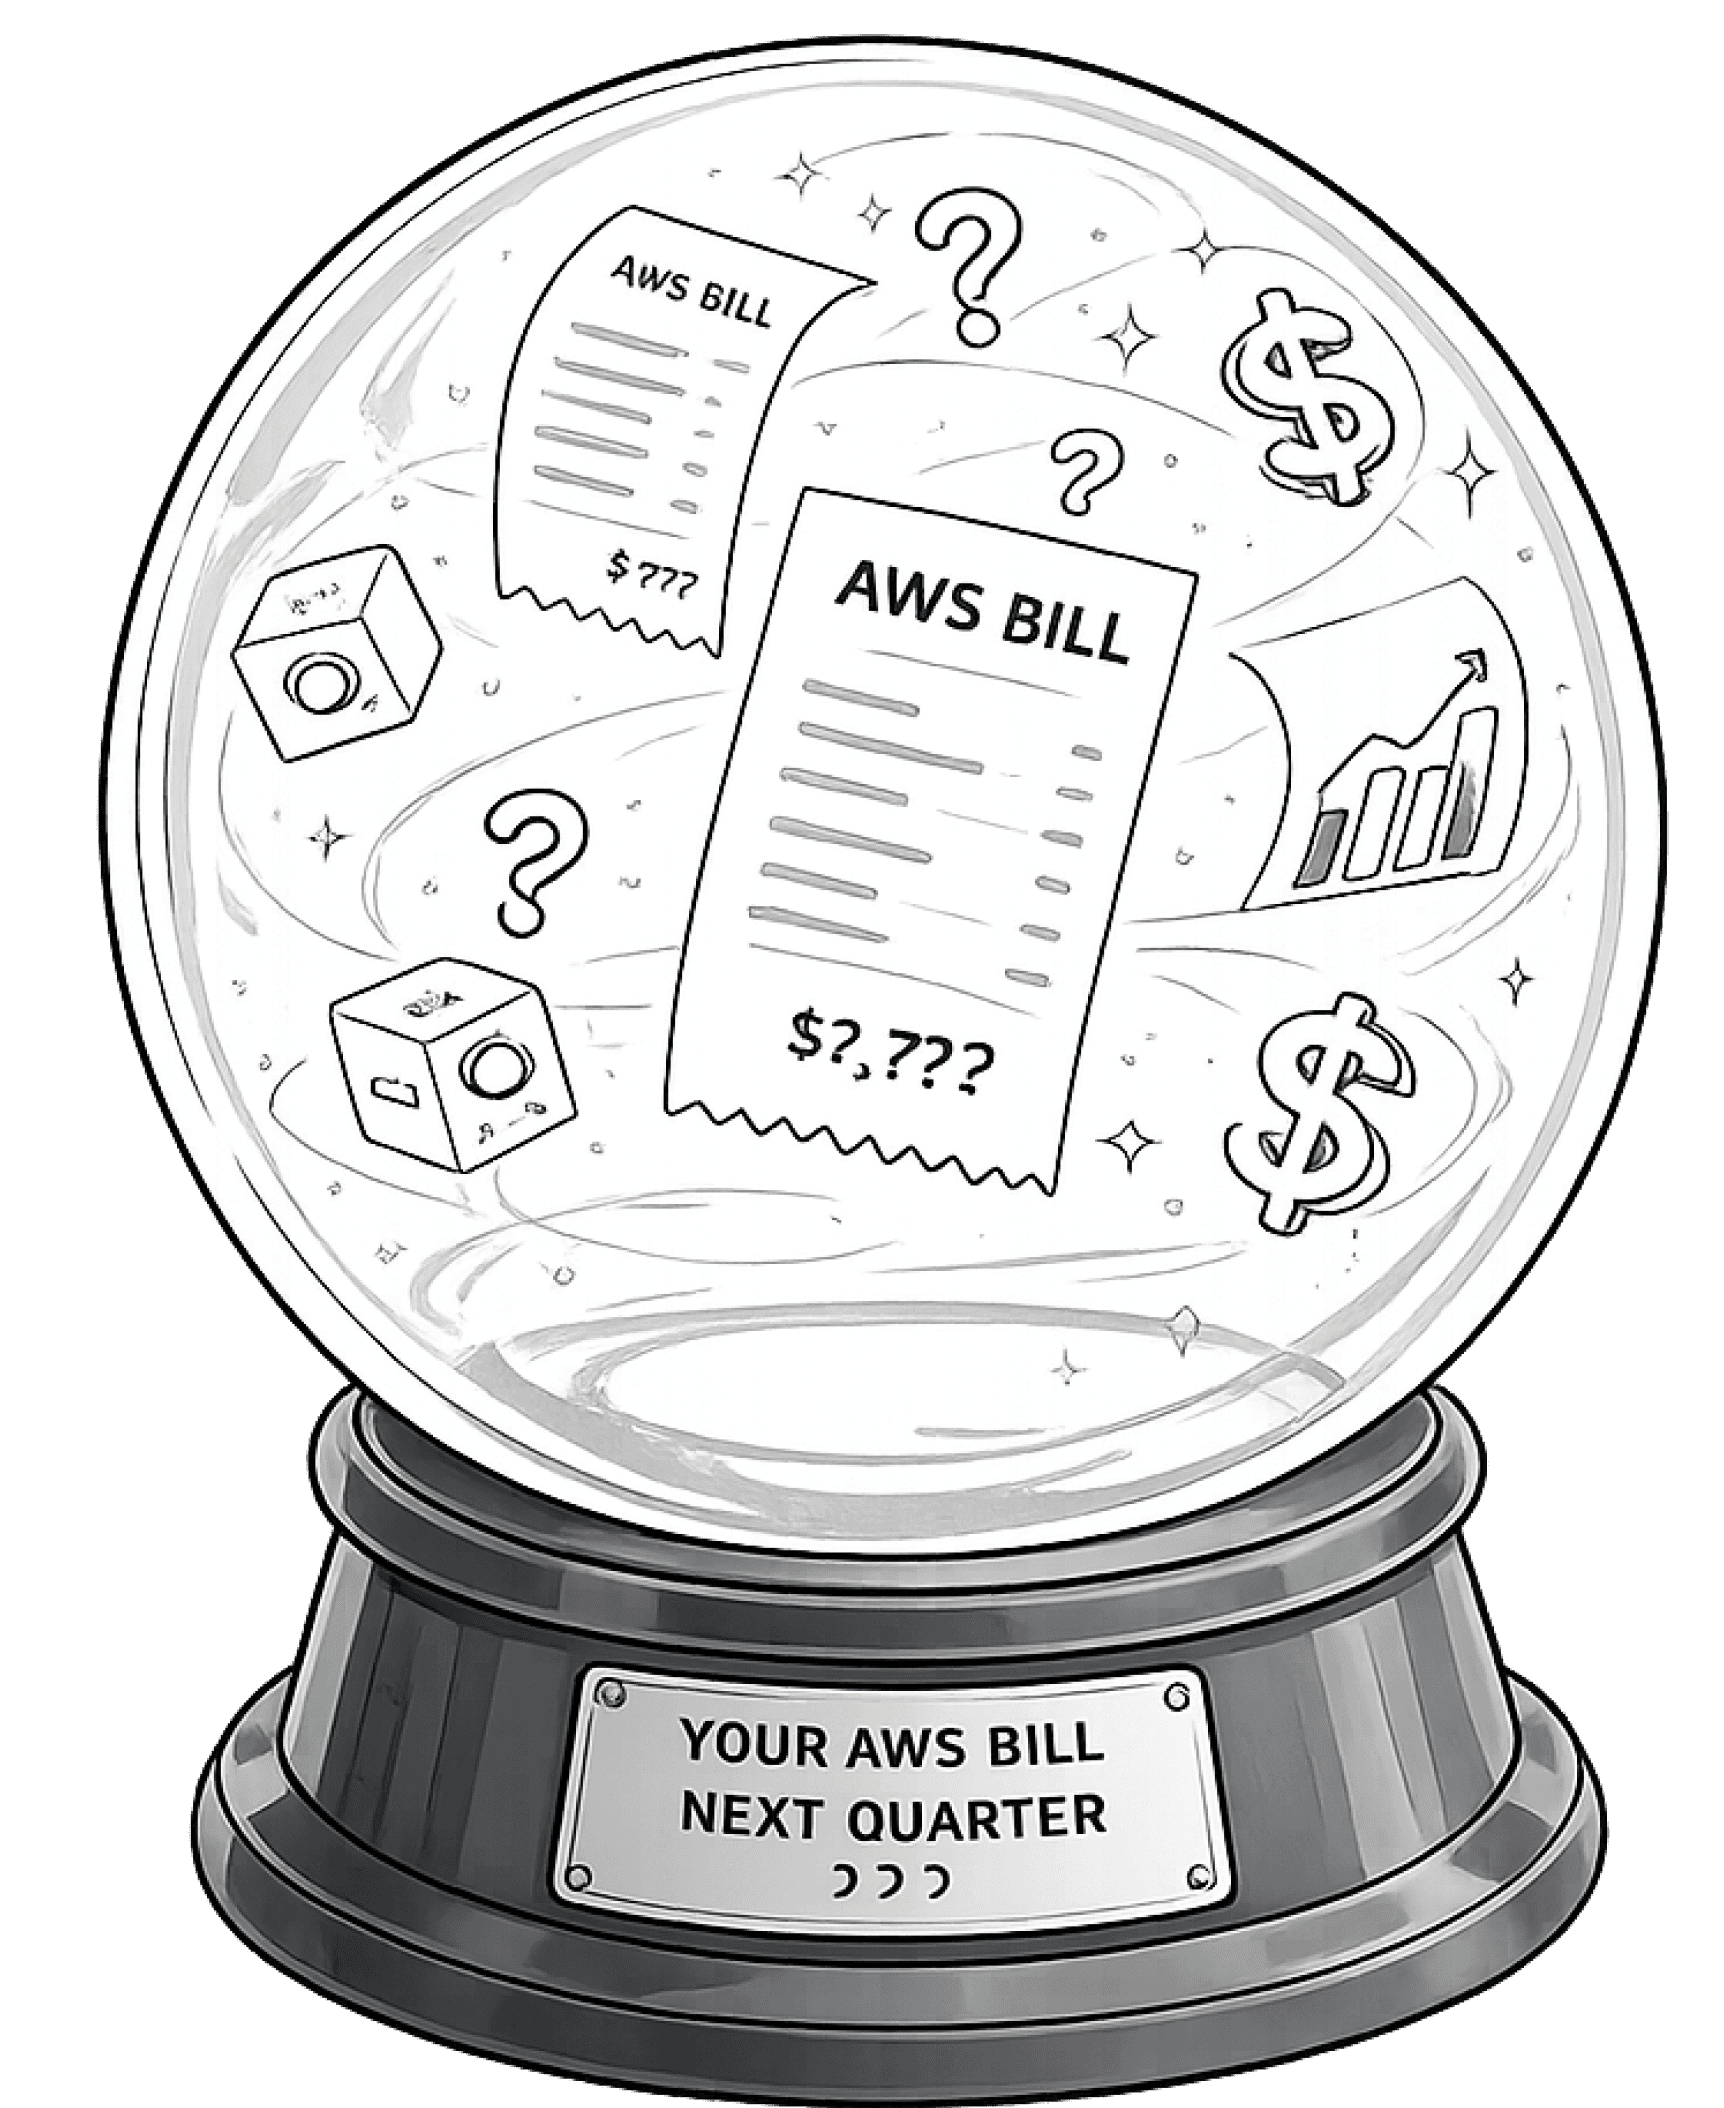
FOR VP ENGINEERING, CTOs & PLATFORM LEADERS
FOR VP ENGINEERING, CTOs & PLATFORM LEADERS
See every engineering decision's dollar impact, before you ship it.
Connect every AWS dollar to the infrastructure behind it with safe optimization and root-cause insights your engineering team can trust with Opsolute.

TRUSTED BY ENGINEERING LEADERS AT AWS-FIRST COMPANIES



THE GAP TODAY, FROM AN ENGINEERING LENS
Three hidden costs. Three production risks.
Three hidden costs. Three production risks.
Cost enters too late. Usually after deployment or when finance raises an issue. That's a broken loop and every engineering leader knows it.

EKS doubles. Nobody sees the $40K.
One canary deployment. Utilization jumps from 40% to 90%. AWS costs rise by $40K that month. Nobody sees the signal in real time. Finance finds out first. Your team finds out from finance.
Month-end is a forensic exercise. Forecasts miss by 20%. The board asks why; and the answer is “we’ll get back to you.” No chargeback. No ownership

Your APM has no cost signal.
Datadog shows latency. Prometheus shows utilization. Neither shows cost per request, service, or engineering decision, leaving teams without the cost impact of what they ship.

Your cost tool has a 20% action problem
Every cost tool recommends savings, but engineers apply only 20% because they can't see what's safe to change. Better to skip a saving than risk production.
You know what you're running.
But not always what it affects.



BUILT FOR THE ENGINEERING WORKFLOW
Three capabilities. Cost for every engineering decision.
SAFE OPTIMIZATION
REAL-TIME ALERTING
OPERATING RHYTHM
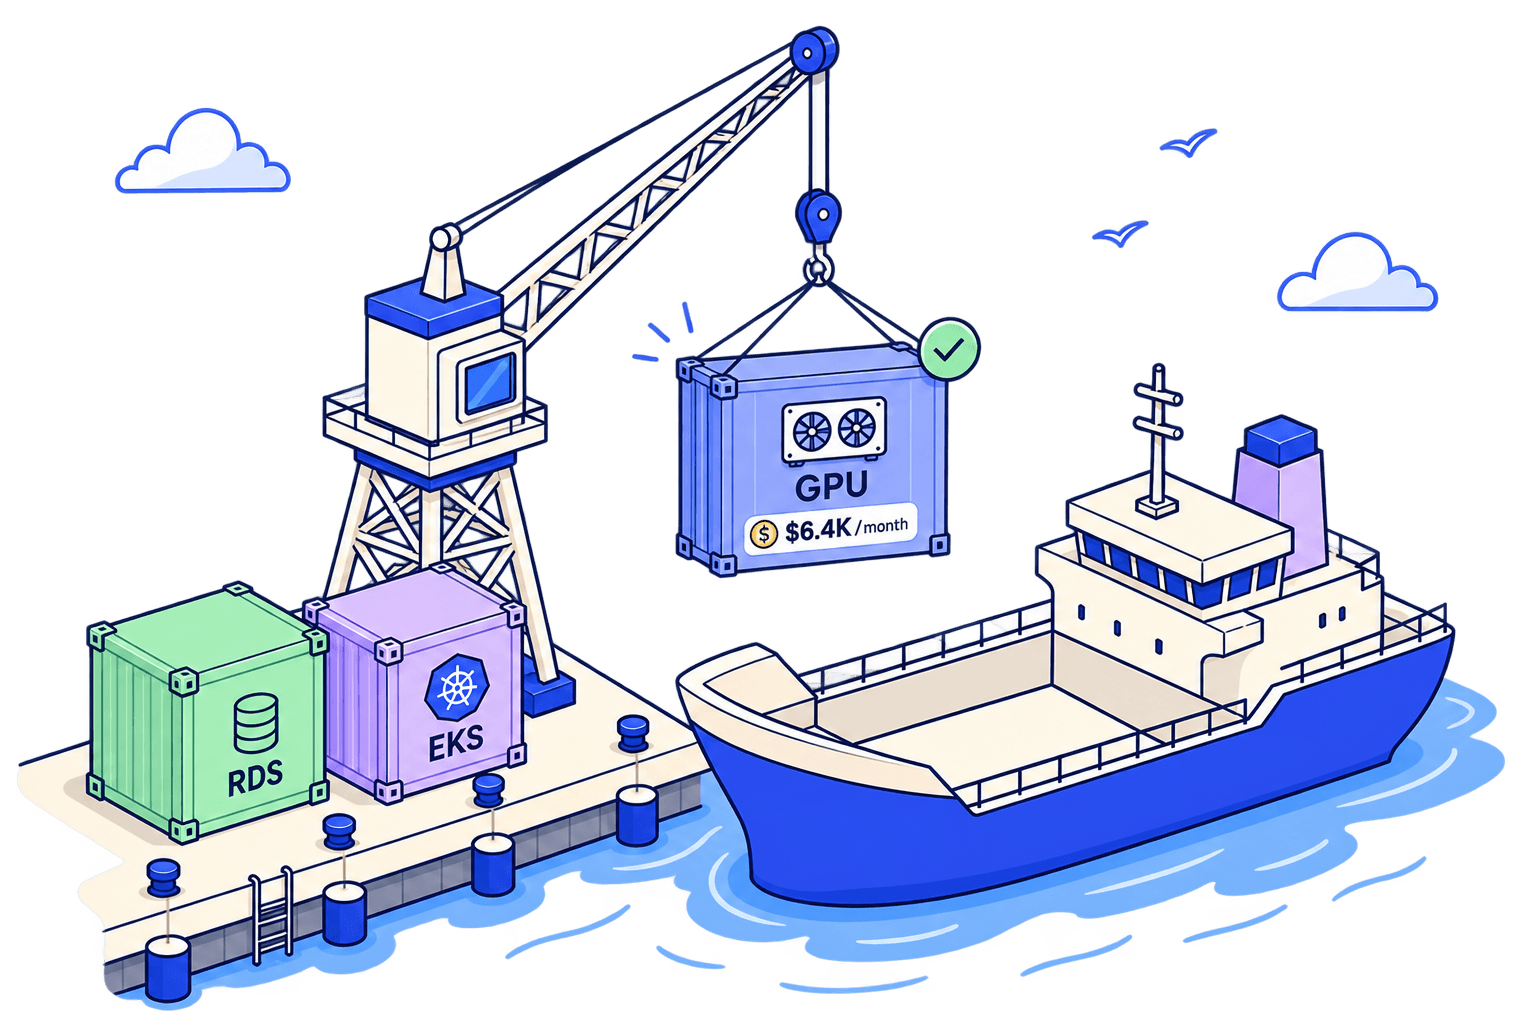
Recommendations with a safety badge, not a savings badge.
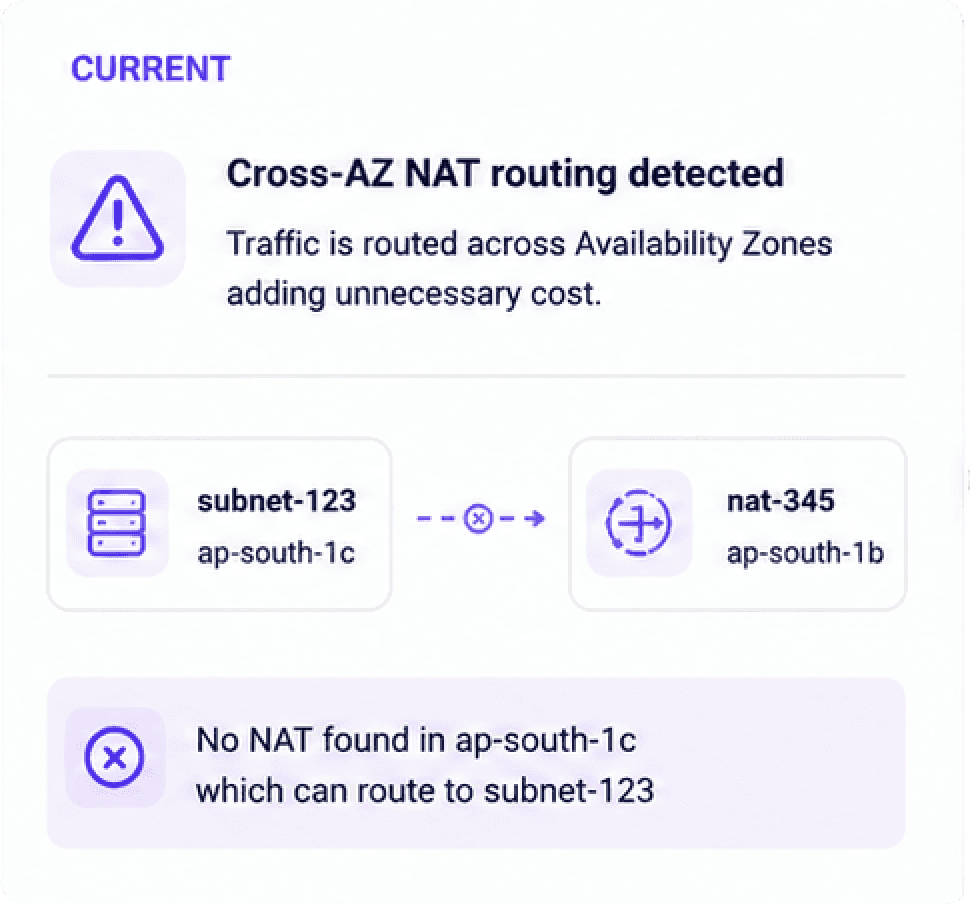
Low utilization doesn't always mean safe to optimize. Opsolute checks dependencies first. An EC2 instance at 8% CPU might support a critical database replica. No dependencies? Green light. Optimize with confidence, not guesswork.
EC2 + RDS rightsizing with safe-to-apply badge
Idle resource detection scored by risk
Savings Plan utilization + purchase simulator
NAT Gateway, S3, ELB usage-pattern optimization
Reserved Instance and Savings Plan propagation across accounts

Every anomaly ships with the root cause attached.
By the time Cost Explorer shows a spike, you've burned $5–30K. Opsolute catches it in under 15 minutes and alerts the right engineer. Every alert shows what changed, when, and where. No 45-minute forensics sprint.
Sub-15-minute MTTD on anomaly detection
Ownership-aware routing (workload → team)
Hourly heatmap for forensic backtrace
RCA on every anomaly — service, deployment, and infrastructure change identified
System rules out of the box, custom rules optional
Auto-classification of anomaly types

Connect your workflow. Bring AWS cost signals into engineering.
The right people get the right cost signals at the right cadence. Engineers get daily actions, managers get weekly rollups, and leadership gets bi-weekly forecasts and savings. Delivered through Slack, email, or in-app.
Daily digest for ICs — yesterday's spend, anomalies, optimization queue
Weekly digest for engineering managers — team rollup, top movers, actions
Bi-weekly executive briefs — forecast vs actual, P&L impact
Multi-channel delivery: Slack, email, in-app
Ownership-aware content per persona
Cashflo currently uses this operating rhythm

INFORM · COST GRAVITY MAP
SAFE OPTIMIZATION
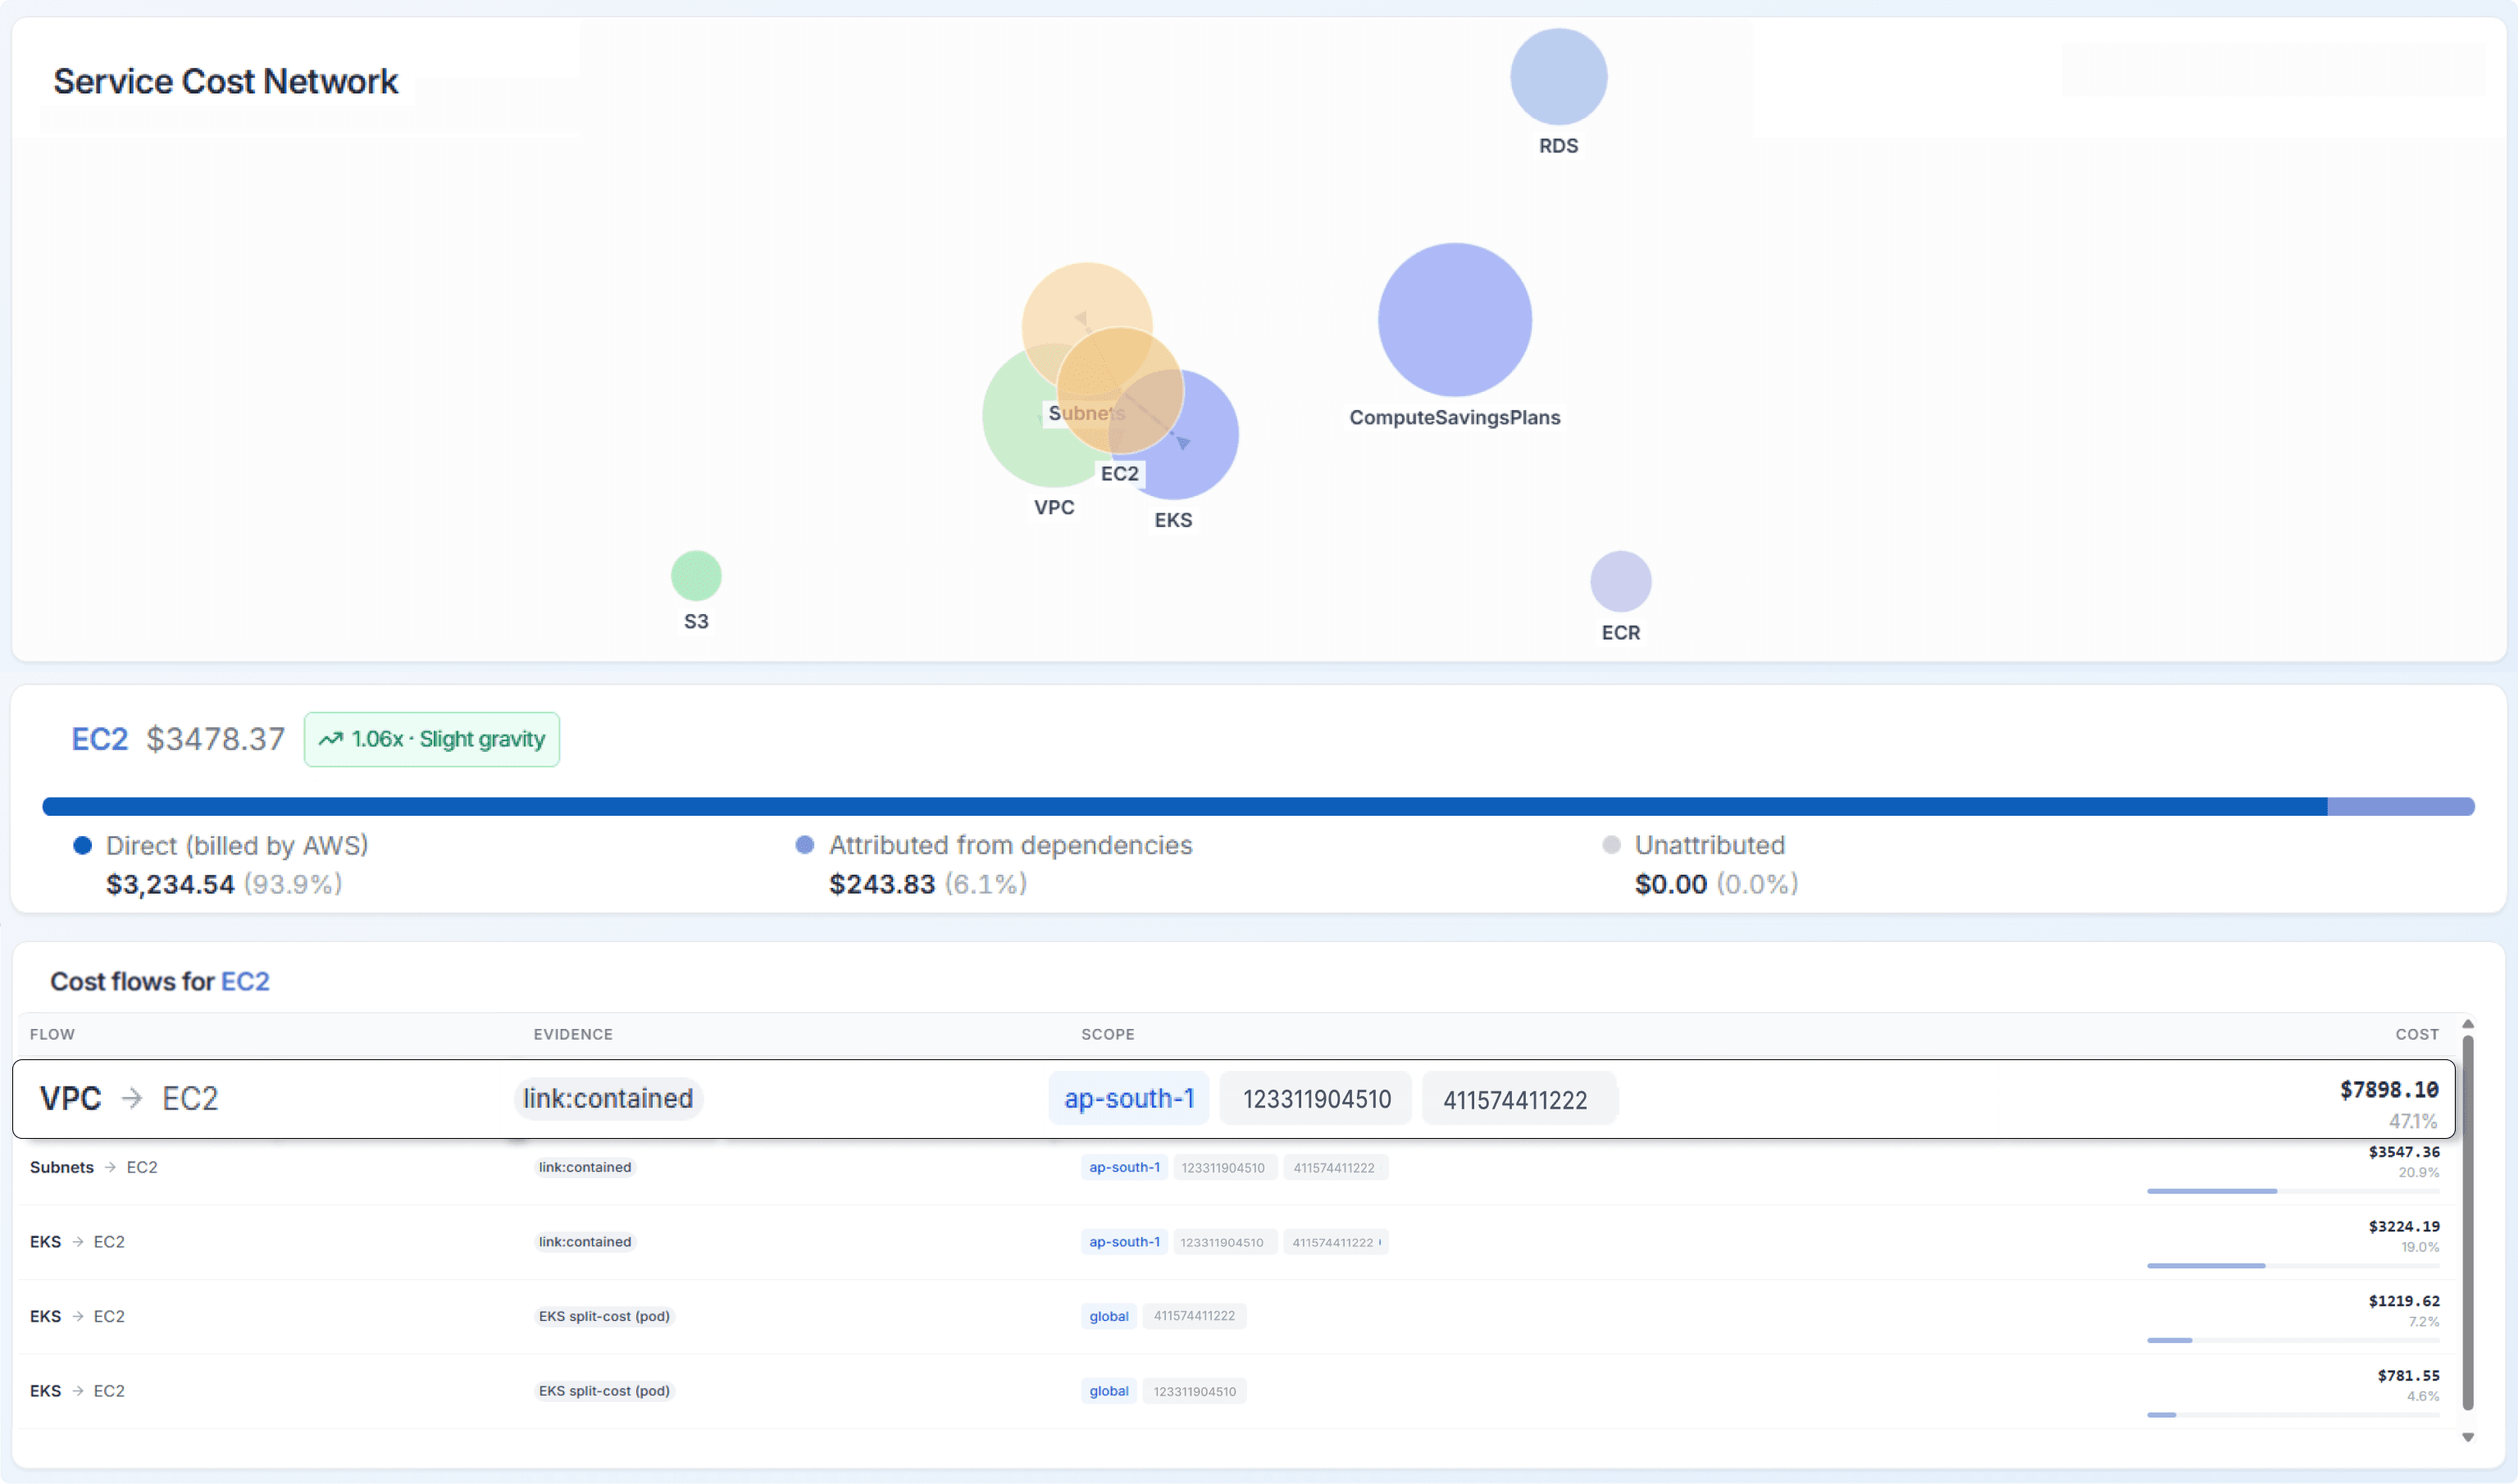
See where your money actually flows — not just where AWS billed it.
Recommendations with a safety badge, not a savings badge.
Most cost tools stop at the line item. Opsolute follows the dependencies. EBS volumes show up against the EC2 instance using them. ENIs roll into their parent EC2. NAT gateway charges land on the workload generating the traffic. Reserved Instances and Savings Plans propagate to the accounts and services where the discount actually applies.
Low utilization doesn't always mean safe to optimize. Opsolute checks dependencies first. An EC2 instance at 8% CPU might support a critical database replica. No dependencies? Green light. Optimize with confidence, not guesswork.
Feature list:
True Cost view — every service folded against the workload that drives it
RI/SP coverage propagation across linked accounts
EKS namespace and pod-level cost attribution
Account-wide unattributed spend report — find what your tags missed
Native AWS Cost Explorer + CloudWatch + CUR ingest, no agents
EC2 + RDS rightsizing with safe-to-apply badge
Idle resource detection scored by risk
Savings Plan utilization + purchase simulator
NAT Gateway, S3, ELB usage-pattern optimization
Reserved Instance and Savings Plan propagation across accounts
INFORM · RISK SURFACE SCORE
Real-Time Alerting
One number that tells you where the financial risk is hiding.
Every anomaly ships with the root cause attached.
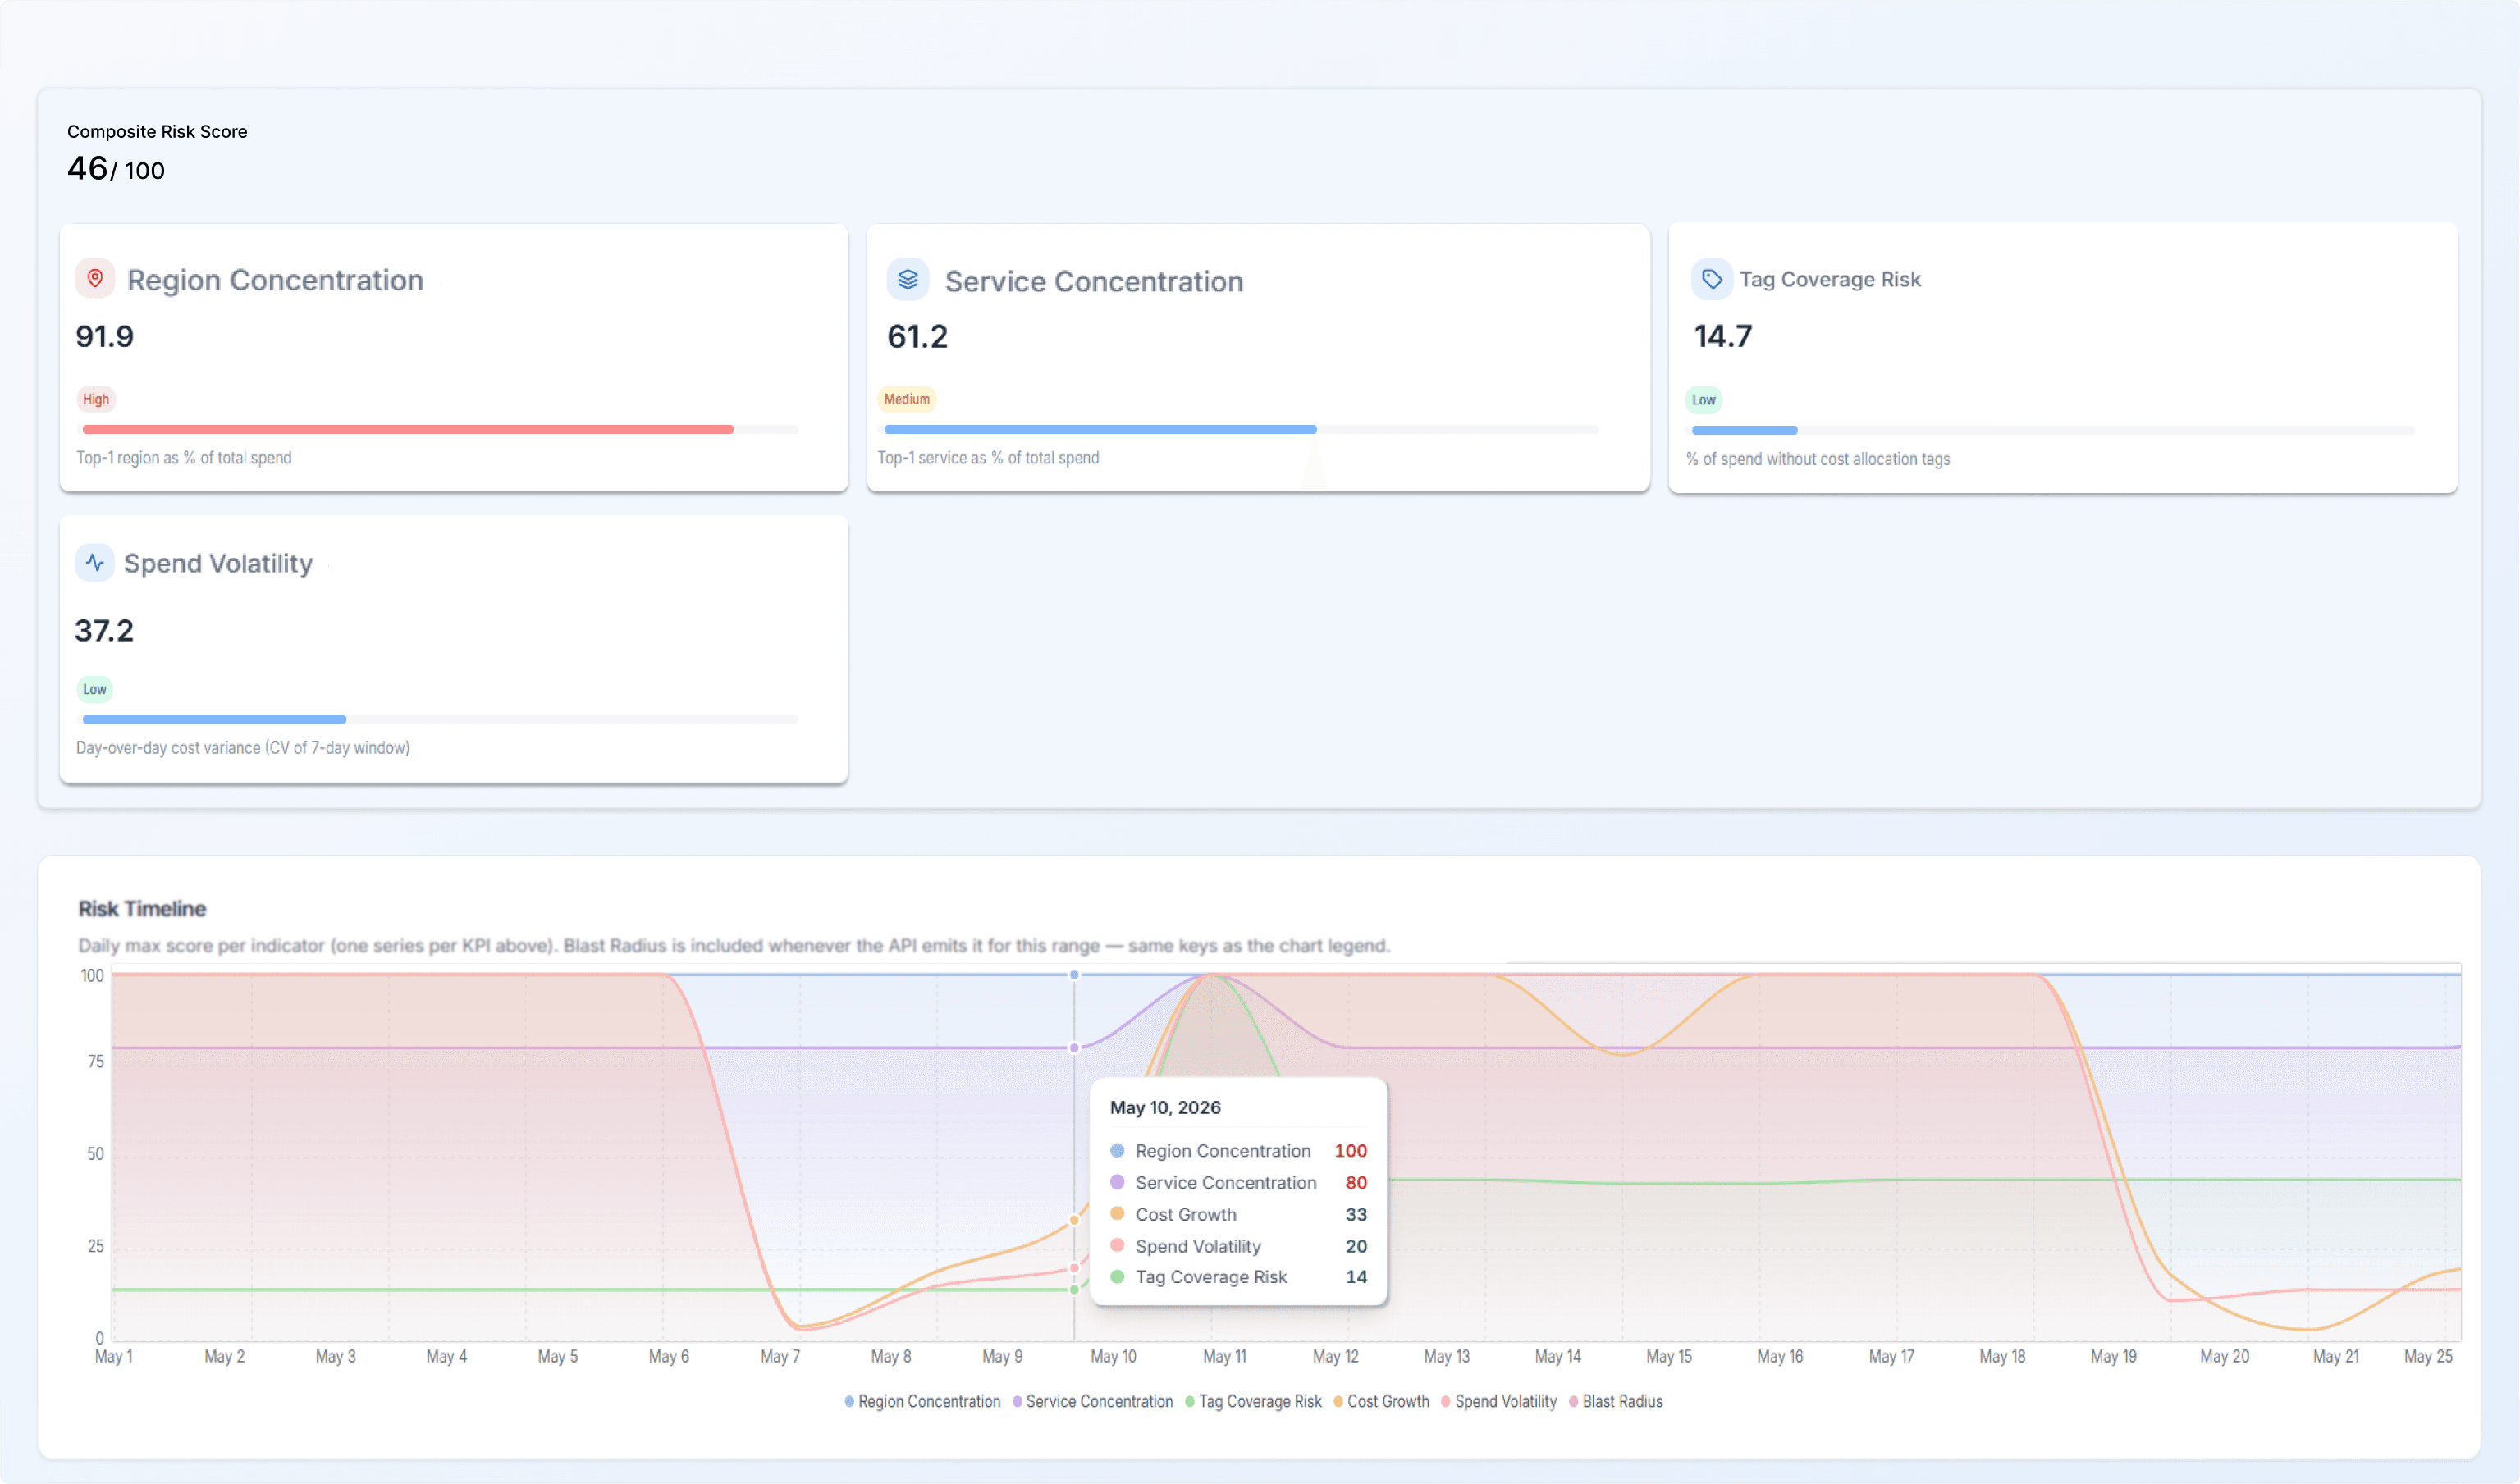
The Risk Surface Score is a single 0–100 number per workload, account, or business unit. It rolls up five signals every CFO cares about and every engineering lead can act on: how volatile the spend is, how steeply it's growing, how concentrated it is in a single service, how concentrated it is in a single region, and how complete the tagging is. Deteriorating scores trigger alerts before they become invoice surprises.
By the time Cost Explorer shows a spike, you've burned $5–30K. Opsolute catches it in under 15 minutes and alerts the right engineer. Every alert shows what changed, when, and where. No 45-minute forensics sprint.
Feature list:
Spend volatility — rolling 30-day variance
Growth slope — current quarter vs trailing 4
Service concentration — single-service exposure (SageMaker, EKS, RDS)
Region concentration — resilience and egress risk
Tag gap — percentage of spend without required cost-allocation tags
Sub-15-minute MTTD on anomaly detection
Ownership-aware routing (workload → team)
Hourly heatmap for forensic backtrace
RCA on every anomaly — service, deployment, and infrastructure change identified
System rules out of the box, custom rules optional
Auto-classification of anomaly types

OPERATE · TAG GRAPH
Operating Rhythm
The chargeback foundation that finally holds up under audit.
Daily, weekly, and bi-weekly standups. Automatically routed.
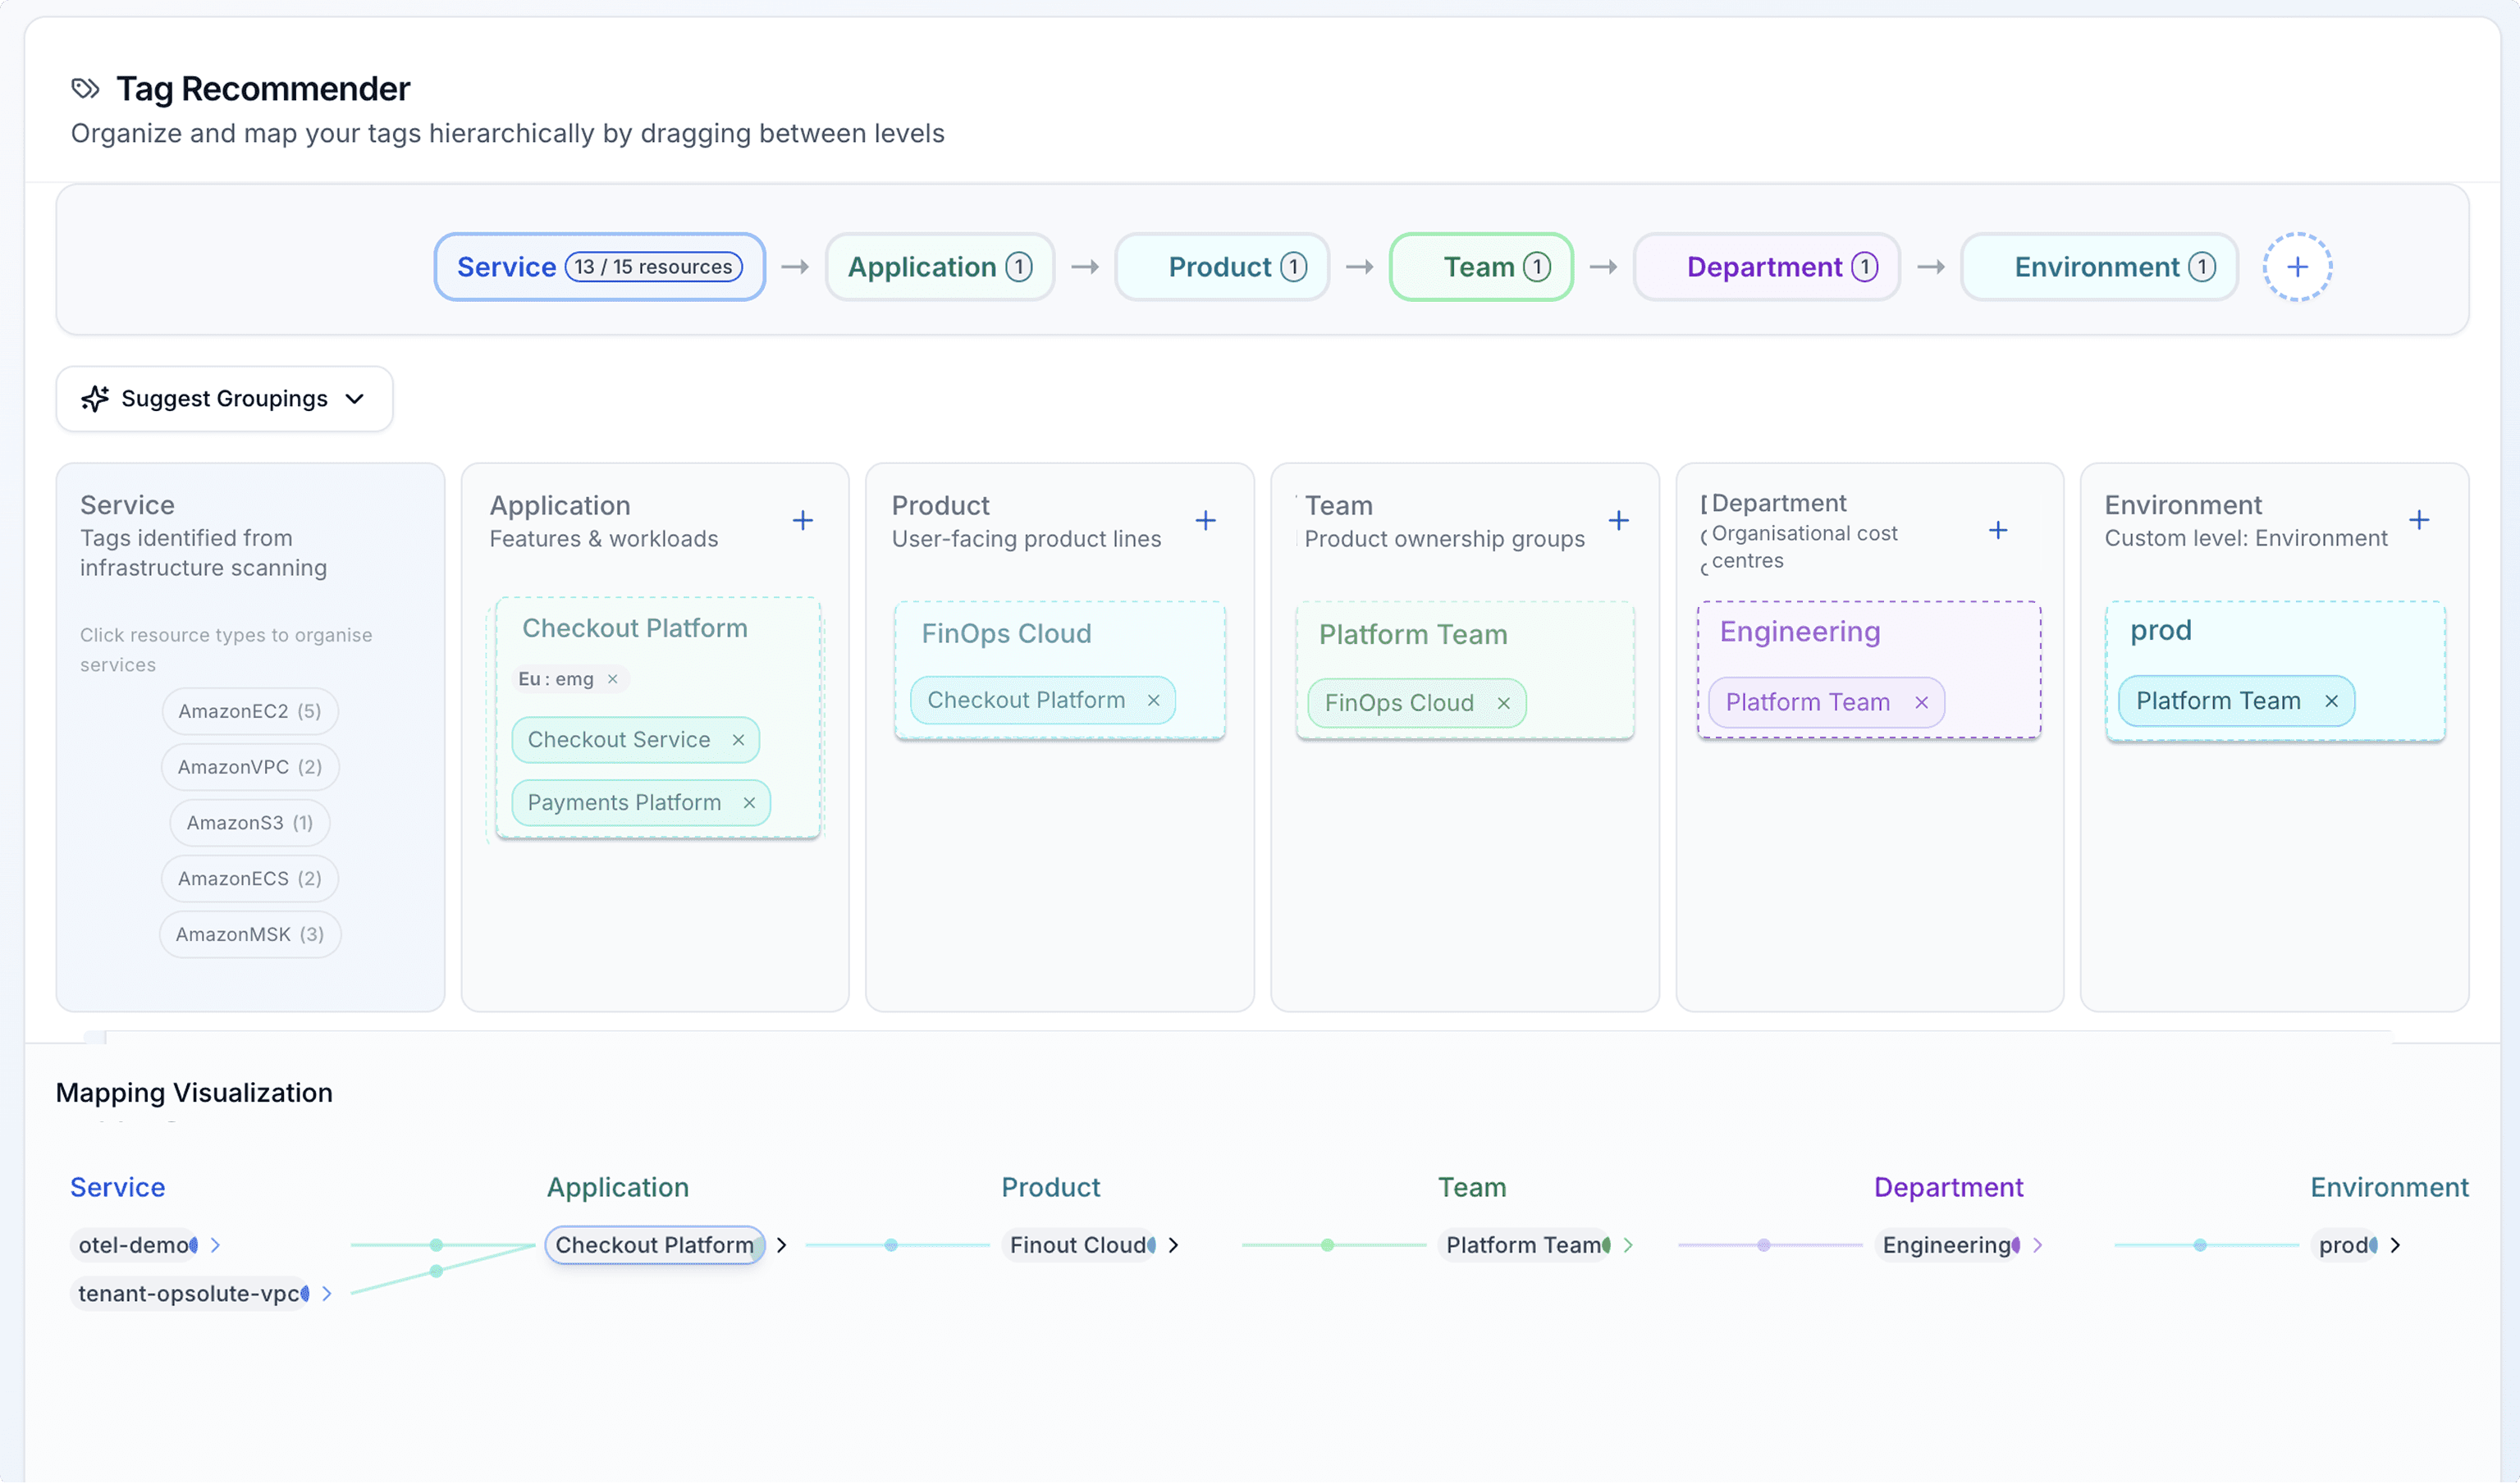
Tag Graph unifies your sprawl. Project, Proj, ProjectName, project_name — collapsed into one. Inheritance rules push tags from accounts to resources automatically. Virtual tags handle the resources AWS won't let you tag at all. Compliance scoring tells you exactly which teams are out of policy. Every change is logged for audit.
Per-product unit economics used to require a quarter of tagging discipline. We discover tenants from your infrastructure. You connect revenue. The board deck reads “Product A: 72%, Product B: 31%.” Not vibes.
Feature list:
Tag unification across spelling, casing, and naming variants
Inheritance rules from account → VPC → resource
Virtual tags for un-taggable AWS resources (EKS pods, NAT gateways, data transfer)
Tag compliance scoring per team and per account
Hierarchical chargeback: Org → Dept → Team → App → Service → Env
Full audit trail of who changed which tag, when, and why
Daily digest for ICs — yesterday's spend, anomalies, optimization queue
Weekly digest for engineering managers — team rollup, top movers, actions
Bi-weekly executive briefs — forecast vs actual, P&L impact
Multi-channel delivery: Slack, email, in-app
Ownership-aware content per persona
Cashflo currently uses this operating rhythm
YOUR NUMBER
Engineering leaders: Unlock $50K–$500K in cloud savings.
Enter AWS spend and account count. See savings from optimization, RCA alerts, and avoided cost surprises.
FROM CONNECT TO CHARGEBACK IN 14 DAYS
Three steps. One engineer. No agents.
No SDK. No auto-instrumentation. No Kubernetes DaemonSet. A read-only IAM role, 30 minutes, and cost signals wired into your engineering workflow in two weeks.
Connect
Link Your AWS Organization
Deploy read-only access via CloudFormation. Opsolute reads your AWS and optional K8s metrics. No resource modifications.
Map
Every dollar attributed
Unify with Tag Graph. Map dependencies with Cost Cortex. Trace spend with Cost Gravity Map. Attribute every workload.
Operate
Weekly run, quarterly forecast
Alerts reach on-call. Digests land in Slack. Recommendations queue in Cost Cortex. Your team decides. You stay in control
Connect
Link Your AWS Organization
Deploy read-only access via CloudFormation. Opsolute reads your AWS and optional K8s metrics. No resource modifications.
Map
Every dollar attributed
Unify with Tag Graph. Map dependencies with Cost Cortex. Trace spend with Cost Gravity Map. Attribute every workload.
Operate
Weekly run, quarterly forecast
Alerts reach on-call. Digests land in Slack. Recommendations queue in Cost Cortex. Your team decides. You stay in control
Faq
The four questions every engineering leader asks.
If you have others, book a 30-minute call. We answer the awkward ones directly.
Do you install agents or auto-instrument my code?
No. Opsolute is agent-less. We ingest AWS Cost Explorer, CUR, and CloudWatch through a read-only IAM role. For Kubernetes cost attribution, we optionally read kube-state-metrics or metrics-server data your existing monitoring already exposes. Zero footprint in your production path.
How does the safe-to-apply badge actually work? What data goes into it?
Five signals: (1) dependency graph: does this resource have downstream consumers? (2) traffic patterns: is it serving live requests right now or idle? (3) recent restart / OOM events: is it stable? (4) associated PodDisruptionBudgets or replica set constraints: can it tolerate a change? (5) tag-based criticality: is it flagged production or non-production? A green "safe" score requires all five to pass. Yellow "review" means one signal is ambiguous. Red "wait" means don't touch it without more investigation. We show you the reasoning behind every score: no black-box scoring.
Does this replace my existing monitoring / APM?
No. Opsolute is a cost-intelligence layer that runs alongside your APM. Datadog / New Relic / Grafana handle performance and reliability. Opsolute handles cost. Both signals should be visible to your engineers. That's the point. Where the two overlap is anomaly correlation: when your cost spikes and your APM sees a latency spike within the same 5-minute window, we surface both.
What Kubernetes attribution do you support today?
Namespace-level cost attribution is live. Pod-level is live for tagged workloads. ECS task-level is live. What's on the roadmap (not shipped): autonomous K8s optimization: non-prod hibernation, autoscaler tuning, bin-packing. That's under active development with design partners. If you want visibility into that roadmap, ask us on the demo call.
Do you install agents or auto-instrument my code?
No. Opsolute is agent-less. We ingest AWS Cost Explorer, CUR, and CloudWatch through a read-only IAM role. For Kubernetes cost attribution, we optionally read kube-state-metrics or metrics-server data your existing monitoring already exposes. Zero footprint in your production path.
How does the safe-to-apply badge actually work? What data goes into it?
Five signals: (1) dependency graph: does this resource have downstream consumers? (2) traffic patterns: is it serving live requests right now or idle? (3) recent restart / OOM events: is it stable? (4) associated PodDisruptionBudgets or replica set constraints: can it tolerate a change? (5) tag-based criticality: is it flagged production or non-production? A green "safe" score requires all five to pass. Yellow "review" means one signal is ambiguous. Red "wait" means don't touch it without more investigation. We show you the reasoning behind every score: no black-box scoring.
Does this replace my existing monitoring / APM?
No. Opsolute is a cost-intelligence layer that runs alongside your APM. Datadog / New Relic / Grafana handle performance and reliability. Opsolute handles cost. Both signals should be visible to your engineers. That's the point. Where the two overlap is anomaly correlation: when your cost spikes and your APM sees a latency spike within the same 5-minute window, we surface both.
What Kubernetes attribution do you support today?
Namespace-level cost attribution is live. Pod-level is live for tagged workloads. ECS task-level is live. What's on the roadmap (not shipped): autonomous K8s optimization: non-prod hibernation, autoscaler tuning, bin-packing. That's under active development with design partners. If you want visibility into that roadmap, ask us on the demo call.
Connect AWS in 30 minutes. See your dependency graph before the call ends.
Book a 30-minute demo. Connect AWS via read-only IAM, explore your Cost Gravity Map, and review three safe optimizations.