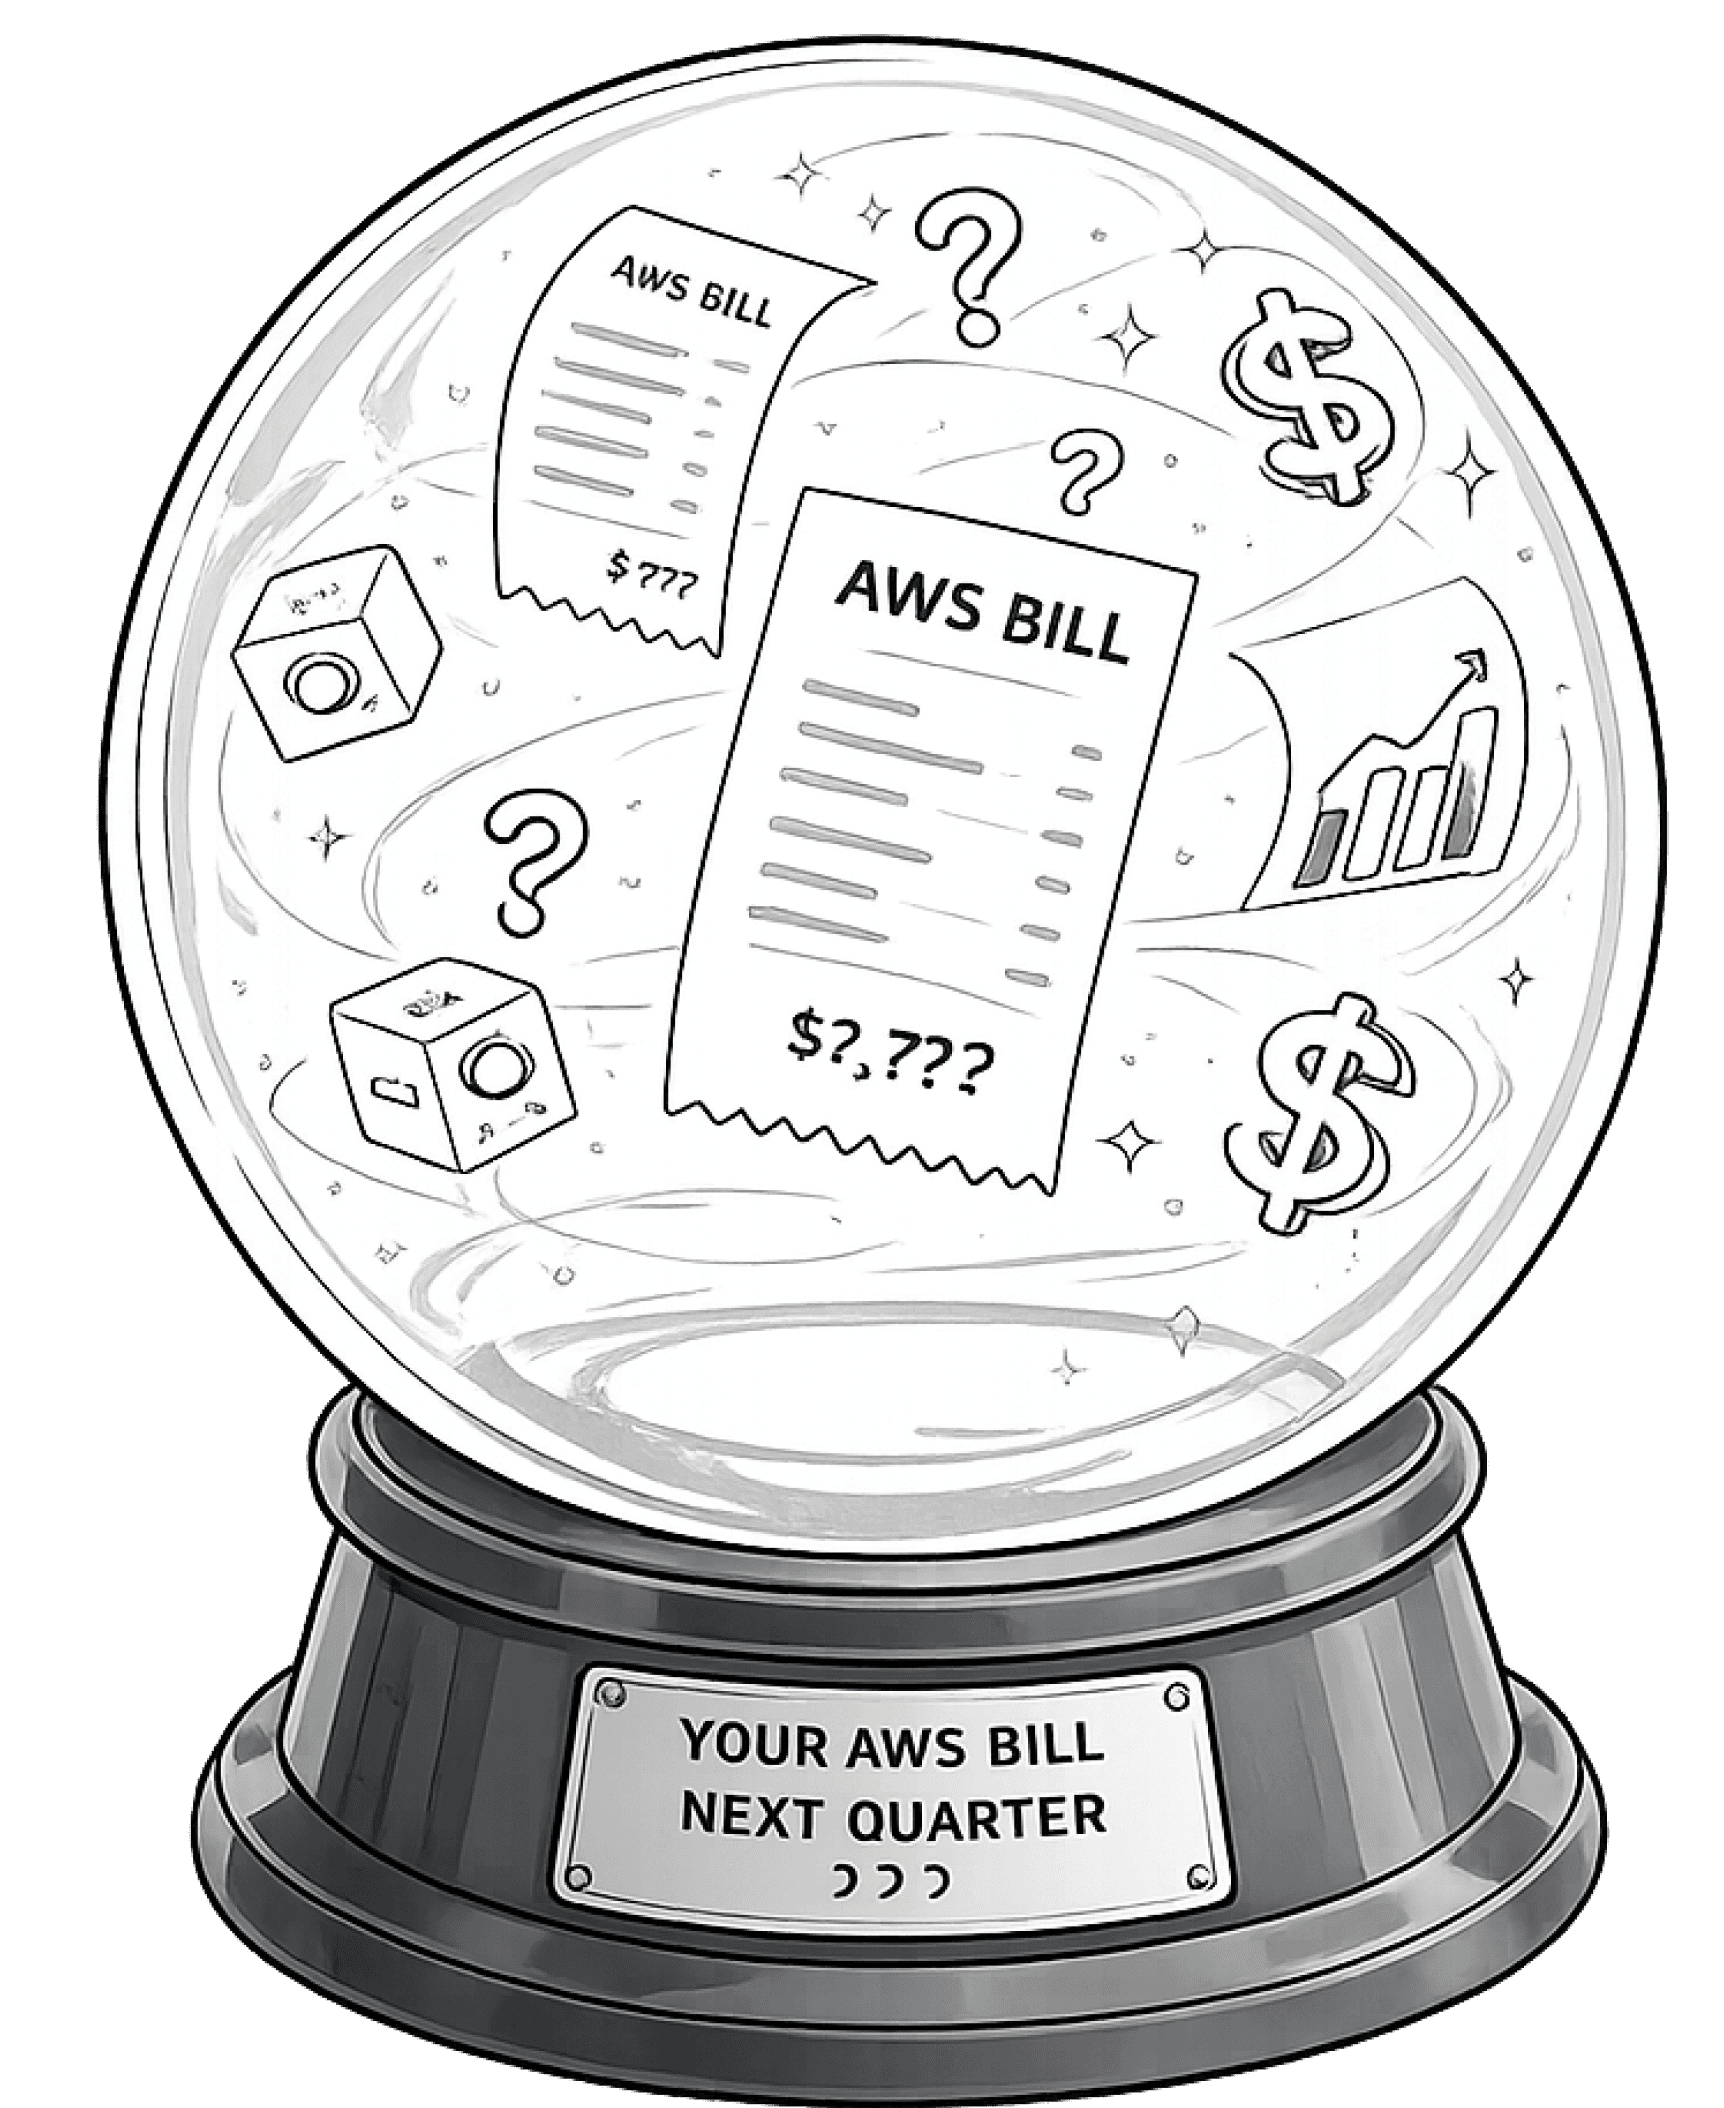
FOR CFOs, VP FINANCE & FP&A LEADERS
FOR CFOs, VP FINANCE & FP&A LEADERS
Be Proactive. Make Cost Decisions Before the Invoice Arrives
Stop reporting cloud costs. Start defending every cloud dollar, with accurate forecasts, audit-ready chargeback, trusted optimization, and board-ready unit economics from Opsolute.


TRUSTED BY FINANCE LEADERS AT AWS-FIRST COMPANIES



THE GAP TODAY, FROM A FINANCE LENS
Four things you already know. Nobody has solved them yet
Four things you already know. Nobody has solved them yet
You have Cost Explorer. You have spreadsheets. You have quarterly close. And you still can't defend the number when the board asks.

Cost optimization never moves beyond recommendations.
Every month, the same savings appear. Rightsizing, idle resources, storage cleanup. Without infrastructure context, cloud waste continues.
Every month, the same savings appear. Rightsizing, idle resources, storage cleanup. Without infrastructure context, cloud waste continues.
Month-end is a forensic exercise. Forecasts miss by 20%. The board asks why; and the answer is “we’ll get back to you.” No chargeback. No ownership.

Forecasts miss by 15–20%. Every quarter.
Monday's bill shows an 8% overrun. Engineering traces it to a new deployment. Next quarter's forecast? Still guesswork. Every month repeats.

Chargeback doesn't survive audit.
Every department gets billed for cloud costs they don't own. Shared analytics and product storage create disputes, drifting chargebacks, and failed audits.
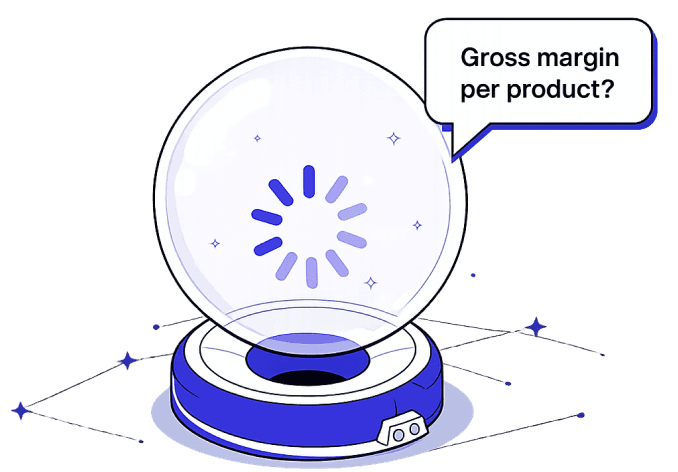
Unit economics is "we'll get back to you."
The board asks, "What's your gross margin per product?" The answer is silence. Investors expect clarity, but attribution and tagging still aren't ready.
Engineering and finance have always spoken different languages.
Every cost tool reads AWS billing. Opsolute understands infrastructure.



BUILT FOR THE FINANCE WORKFLOW
Four capabilities. One board-ready number.
COST OPTIMIZATION
FORECASTING
CHARGEBACK
UNIT ECONOMICS
Optimization recommendations your engineering team can trust
The FinOps team identifies a $15K/month savings opportunity. Opsolute maps infrastructure dependencies, evaluates production risk, and recommends the safest optimization path.
Dependency-aware optimization recommendations
Live workload utilization analysis
Safe rightsizing across AWS & Kubernetes
Risk-scored optimization opportunities

Forecasts you can trust, month after month.
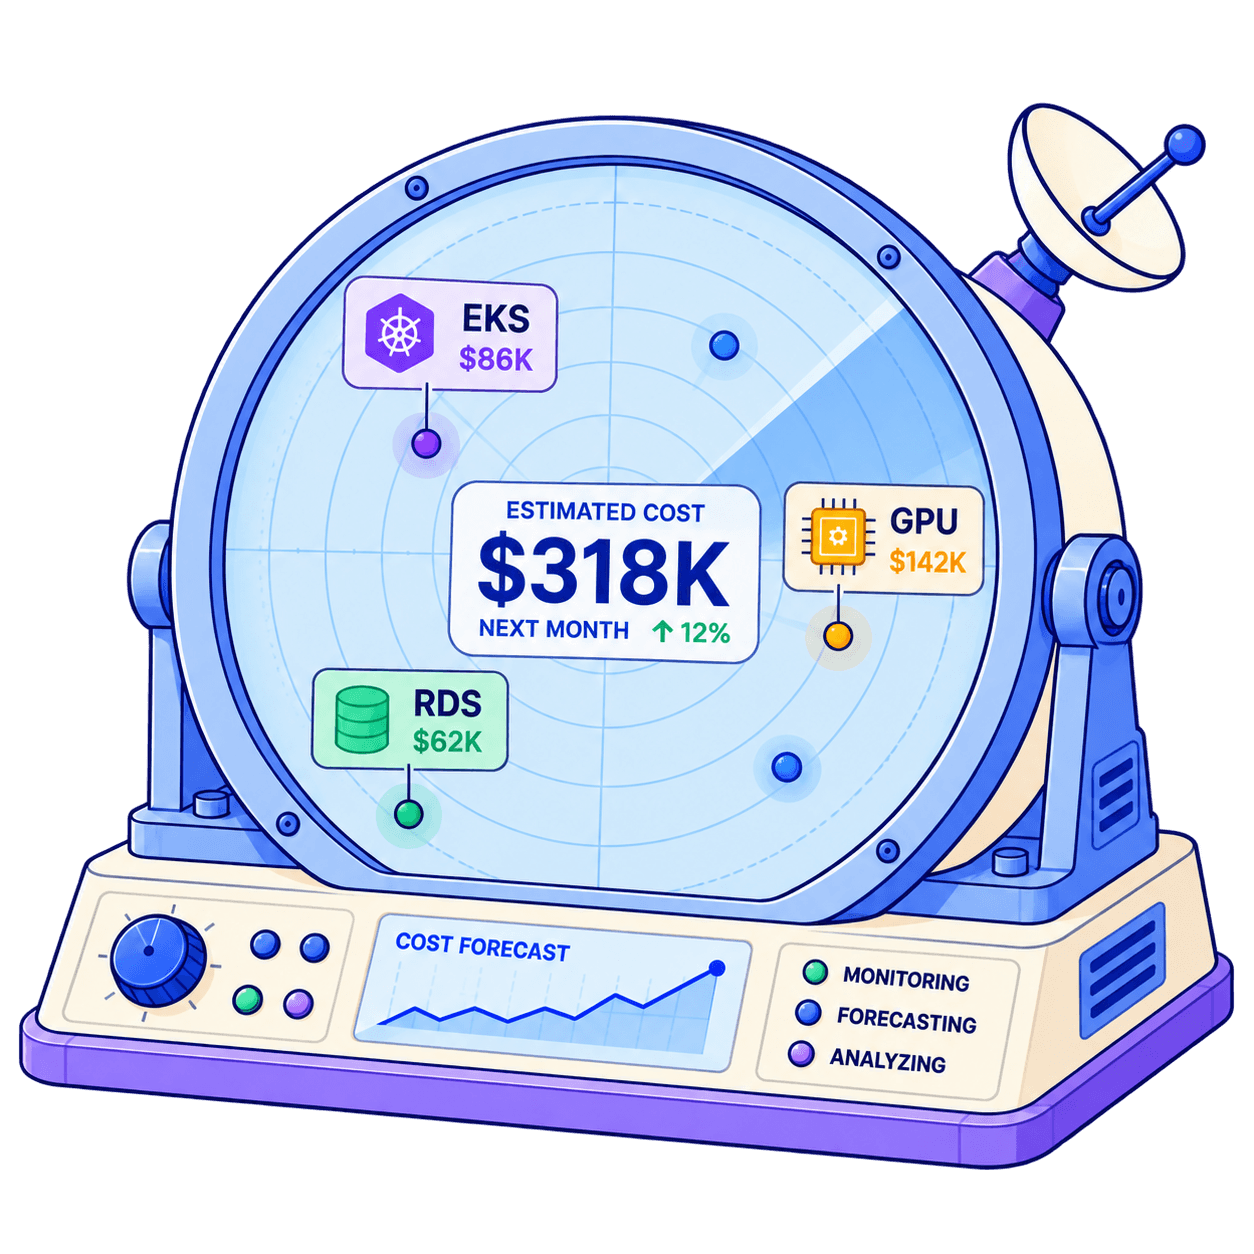
Cloud forecasting shouldn't be an educated guess. Opsolute combines historical spend with real-time infrastructure activity, continuously updating forecasts as workloads evolve and measuring their accuracy over time.
Workload-behavior modeling, not simple linear extrapolation
MAPE tracking per workload, per account, per business unit
Volatility flag on unpredictable workloads
Scenario planning: "what if we add a new region?" answered in seconds

The chargeback line that survives audit.
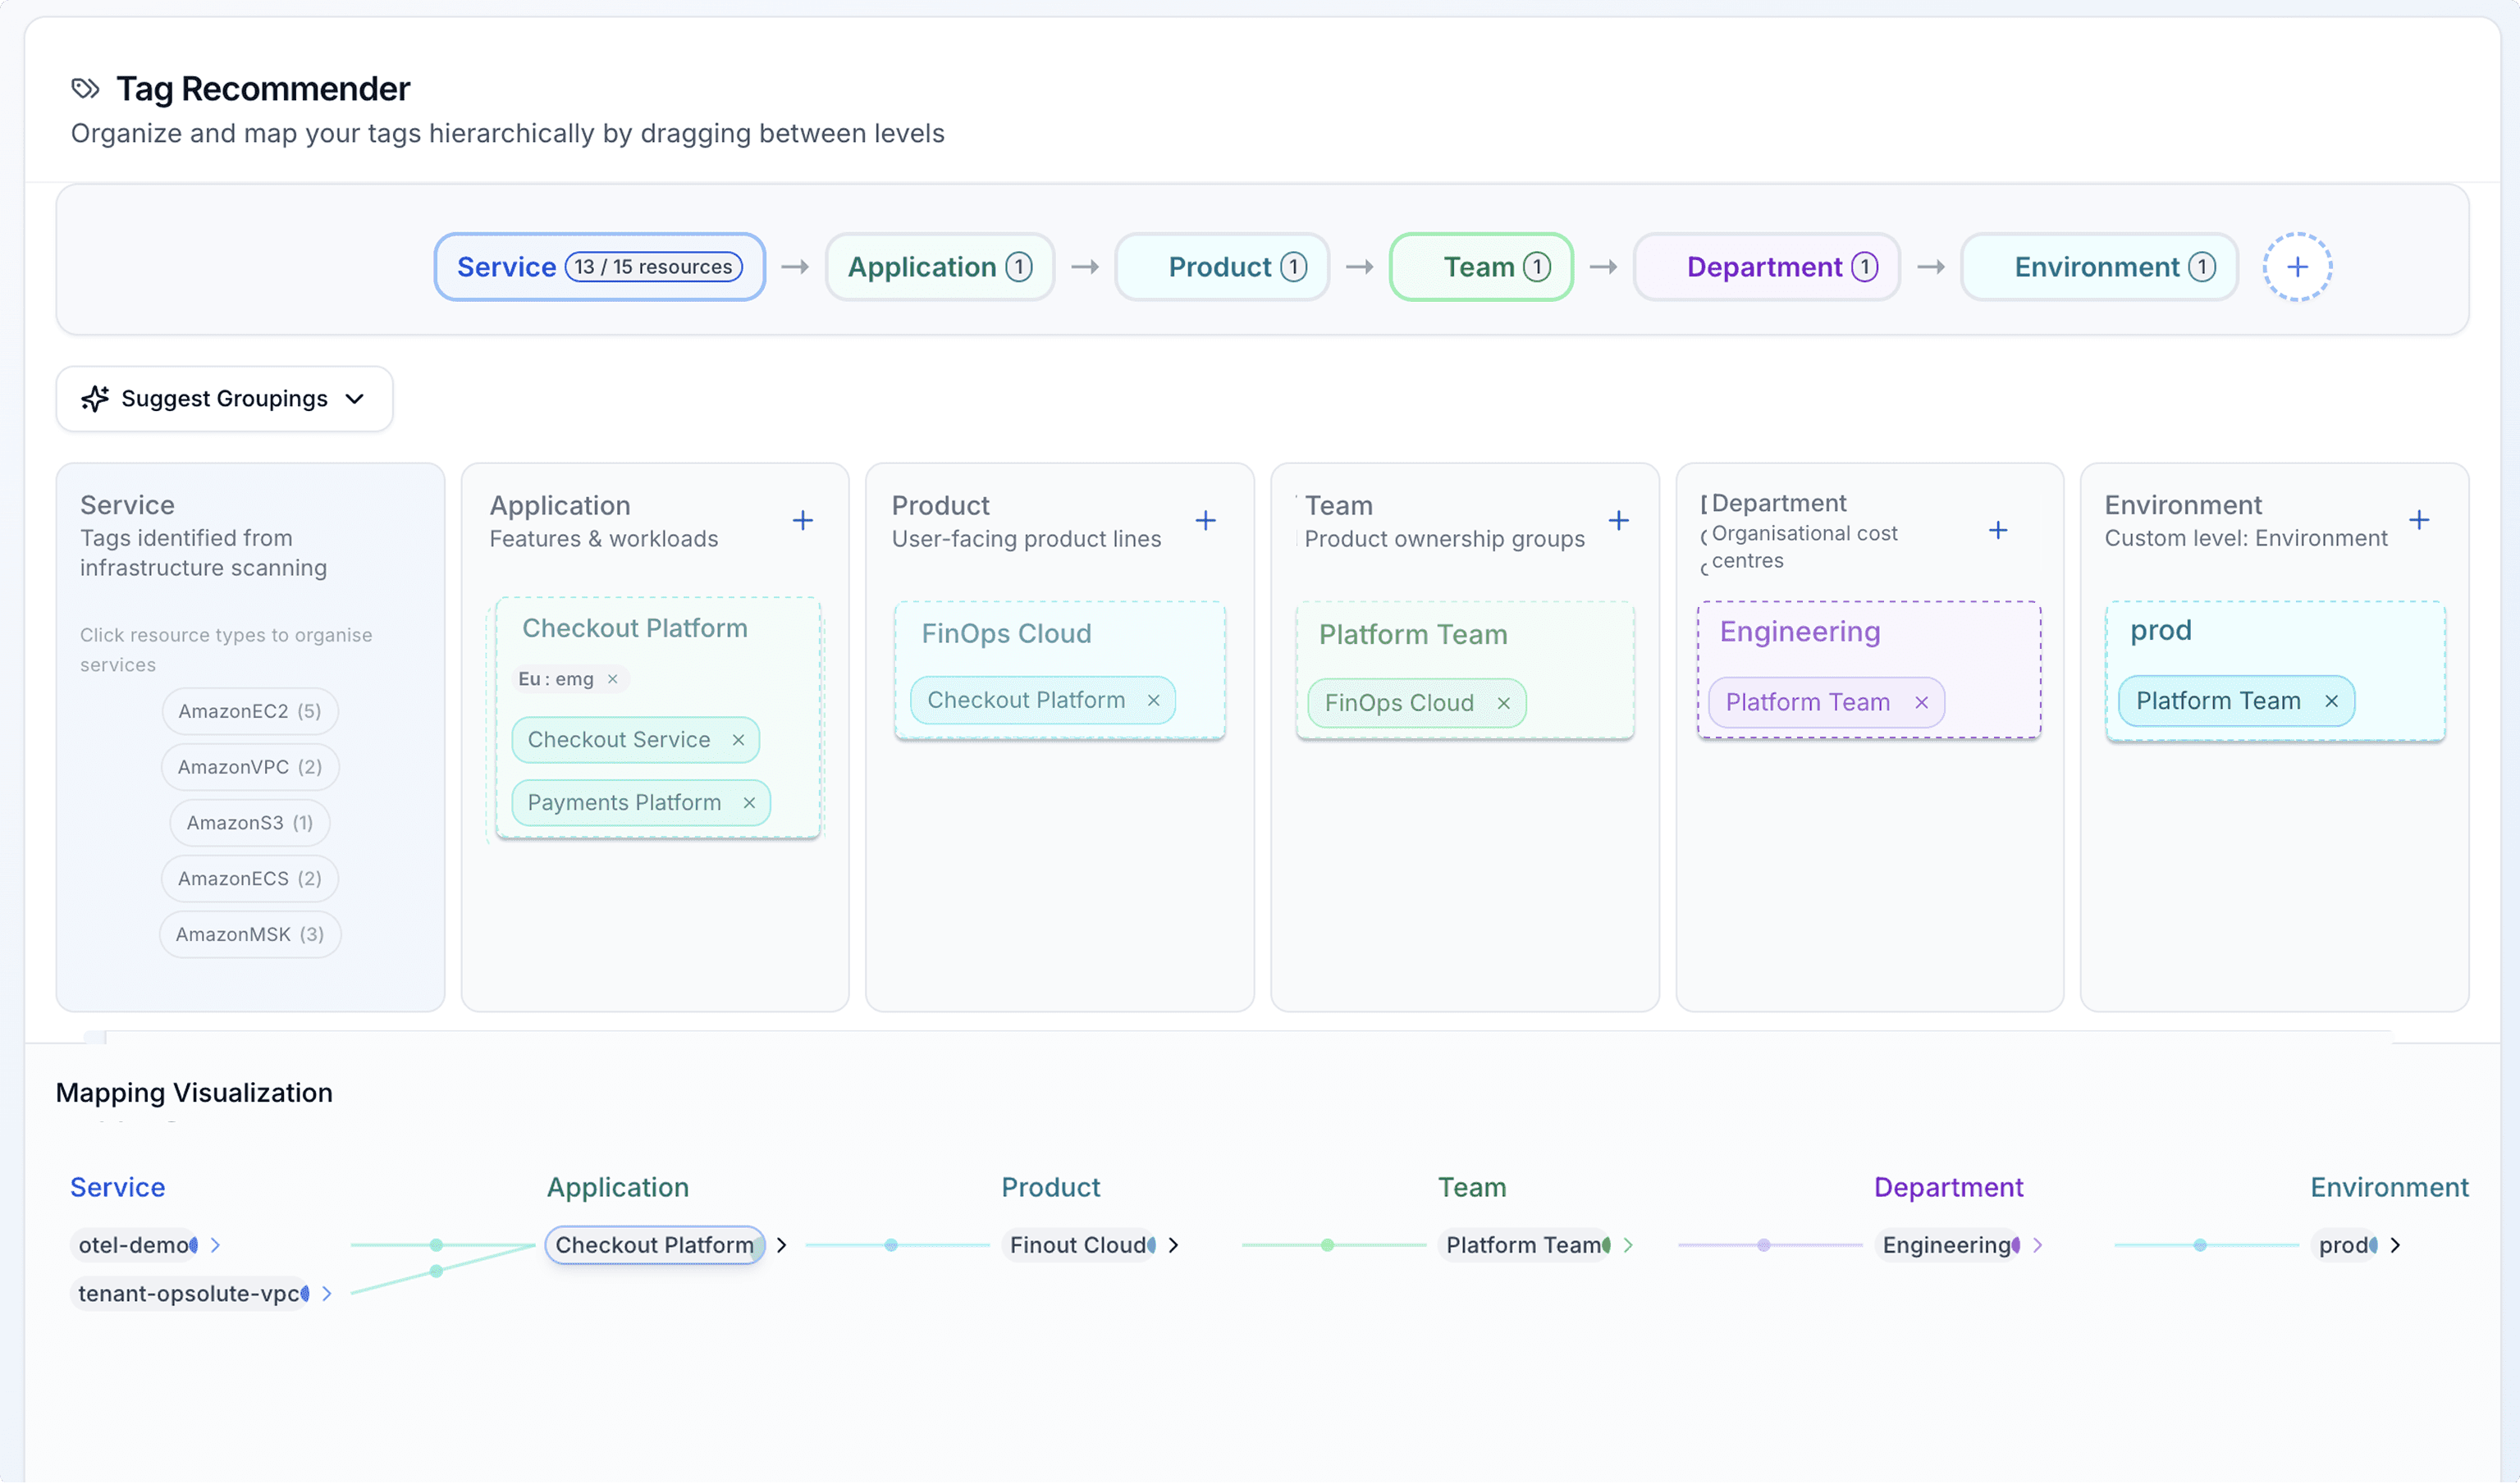
Finance attributes the bill. Engineering asks, "Can you show us why?" Tag Graph unifies tag sprawl, inherits missing tags, fills AWS tagging gaps with virtual tags, and records every change, so the answer is always there.
Hierarchical roll-up: Org → Dept → Team → App → Service → Env
Tag unification across naming variants (case, spelling, spacing)
Inheritance rules from account → VPC → resource
Virtual tags for un-taggable AWS resources
Full audit trail — who changed which tag, when, and why
Cost per customer. Cost per product. Ready in 90 days.
The board asks, "What's our gross margin by product?" Opsolute discovers tenants from EKS, ECS, RDS, and EC2, then joins them to revenue via connectors. The answer is 72% and 31%, real numbers, not vibes.
Auto-discovery from EKS, ECS, RDS, EC2 metadata
Five revenue connectors: HTTP, RDS, CSV, Mongo, push
Hierarchical showback (Org → Team → Product → Customer)
Board-ready CSV / PDF export
Cost-per-transaction and cost-per-API-request breakdowns for tech-heavy products

INFORM · COST GRAVITY MAP
COST OPTIMIZATION
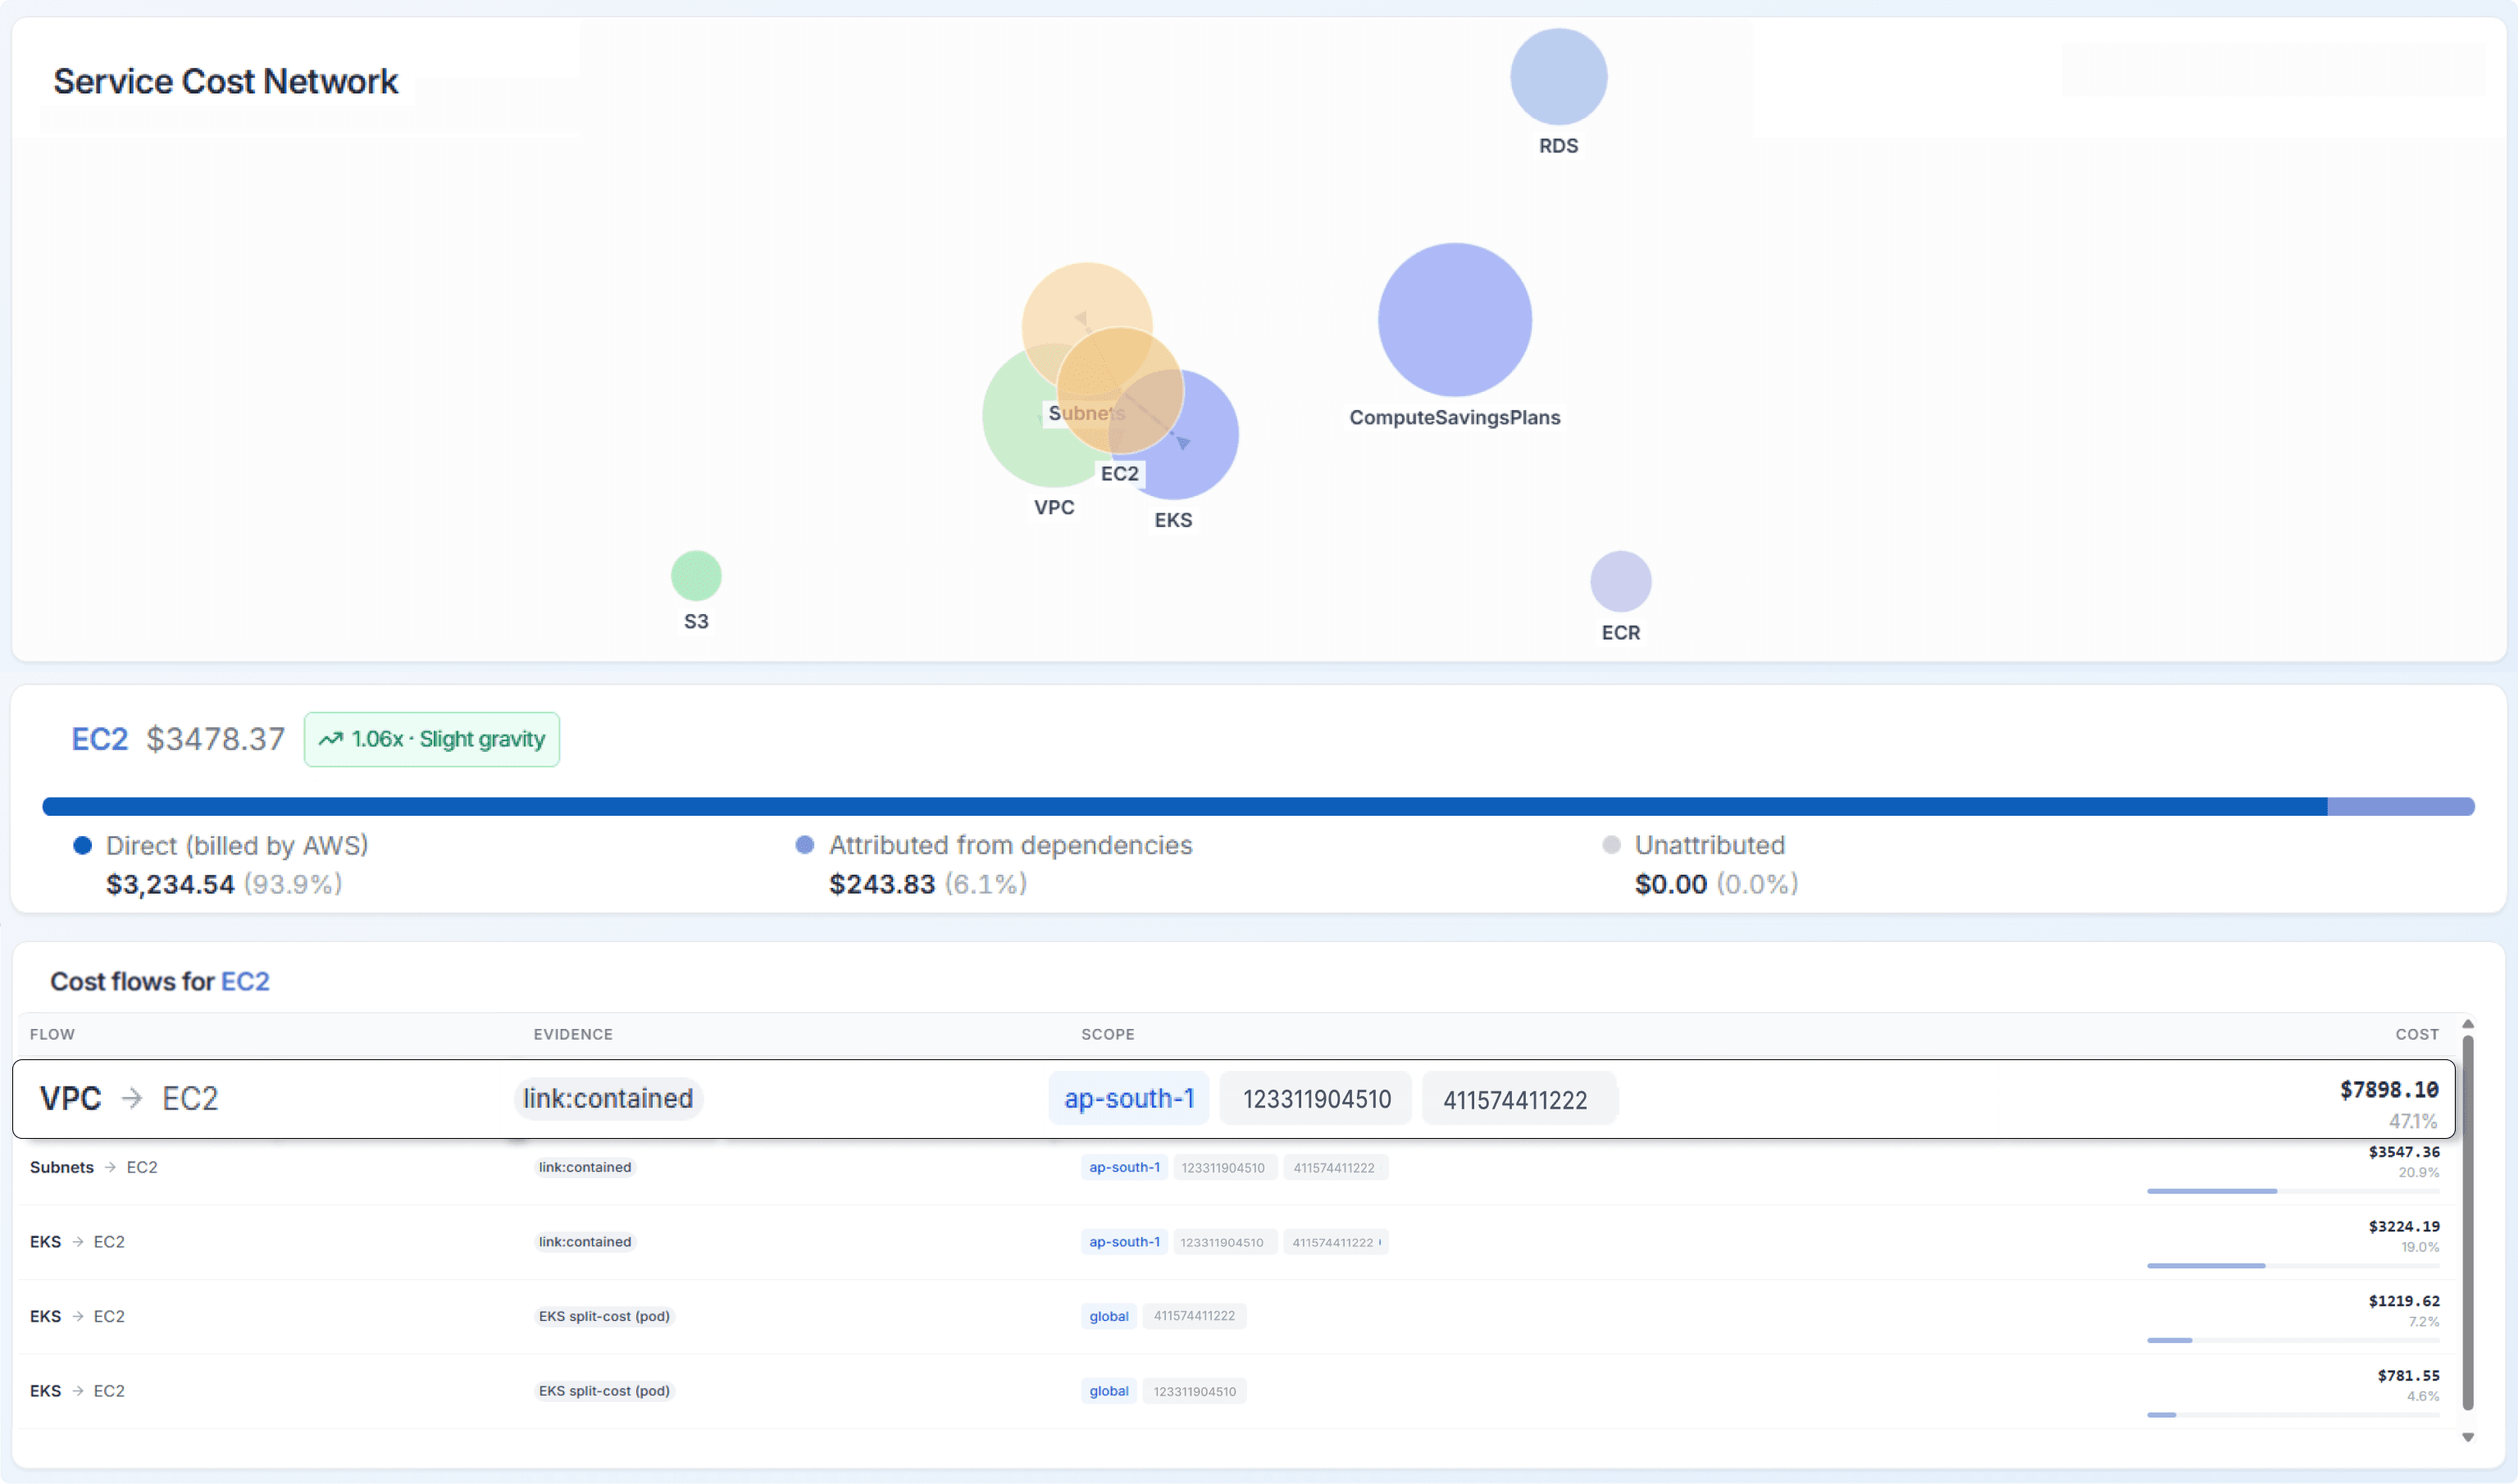
See where your money actually flows — not just where AWS billed it.
The optimization decision engineering team can trust
Most cost tools stop at the line item. Opsolute follows the dependencies. EBS volumes show up against the EC2 instance using them. ENIs roll into their parent EC2. NAT gateway charges land on the workload generating the traffic. Reserved Instances and Savings Plans propagate to the accounts and services where the discount actually applies.
The FinOps team identifies a $15K/month savings opportunity. Opsolute maps infrastructure dependencies, evaluates production risk, and recommends the safest optimization path.
Feature list:
True Cost view — every service folded against the workload that drives it
RI/SP coverage propagation across linked accounts
EKS namespace and pod-level cost attribution
Account-wide unattributed spend report — find what your tags missed
Native AWS Cost Explorer + CloudWatch + CUR ingest, no agents
Dependency-aware optimization recommendations
Live workload utilization analysis
Safe rightsizing across AWS & Kubernetes
Risk-scored optimization opportunities
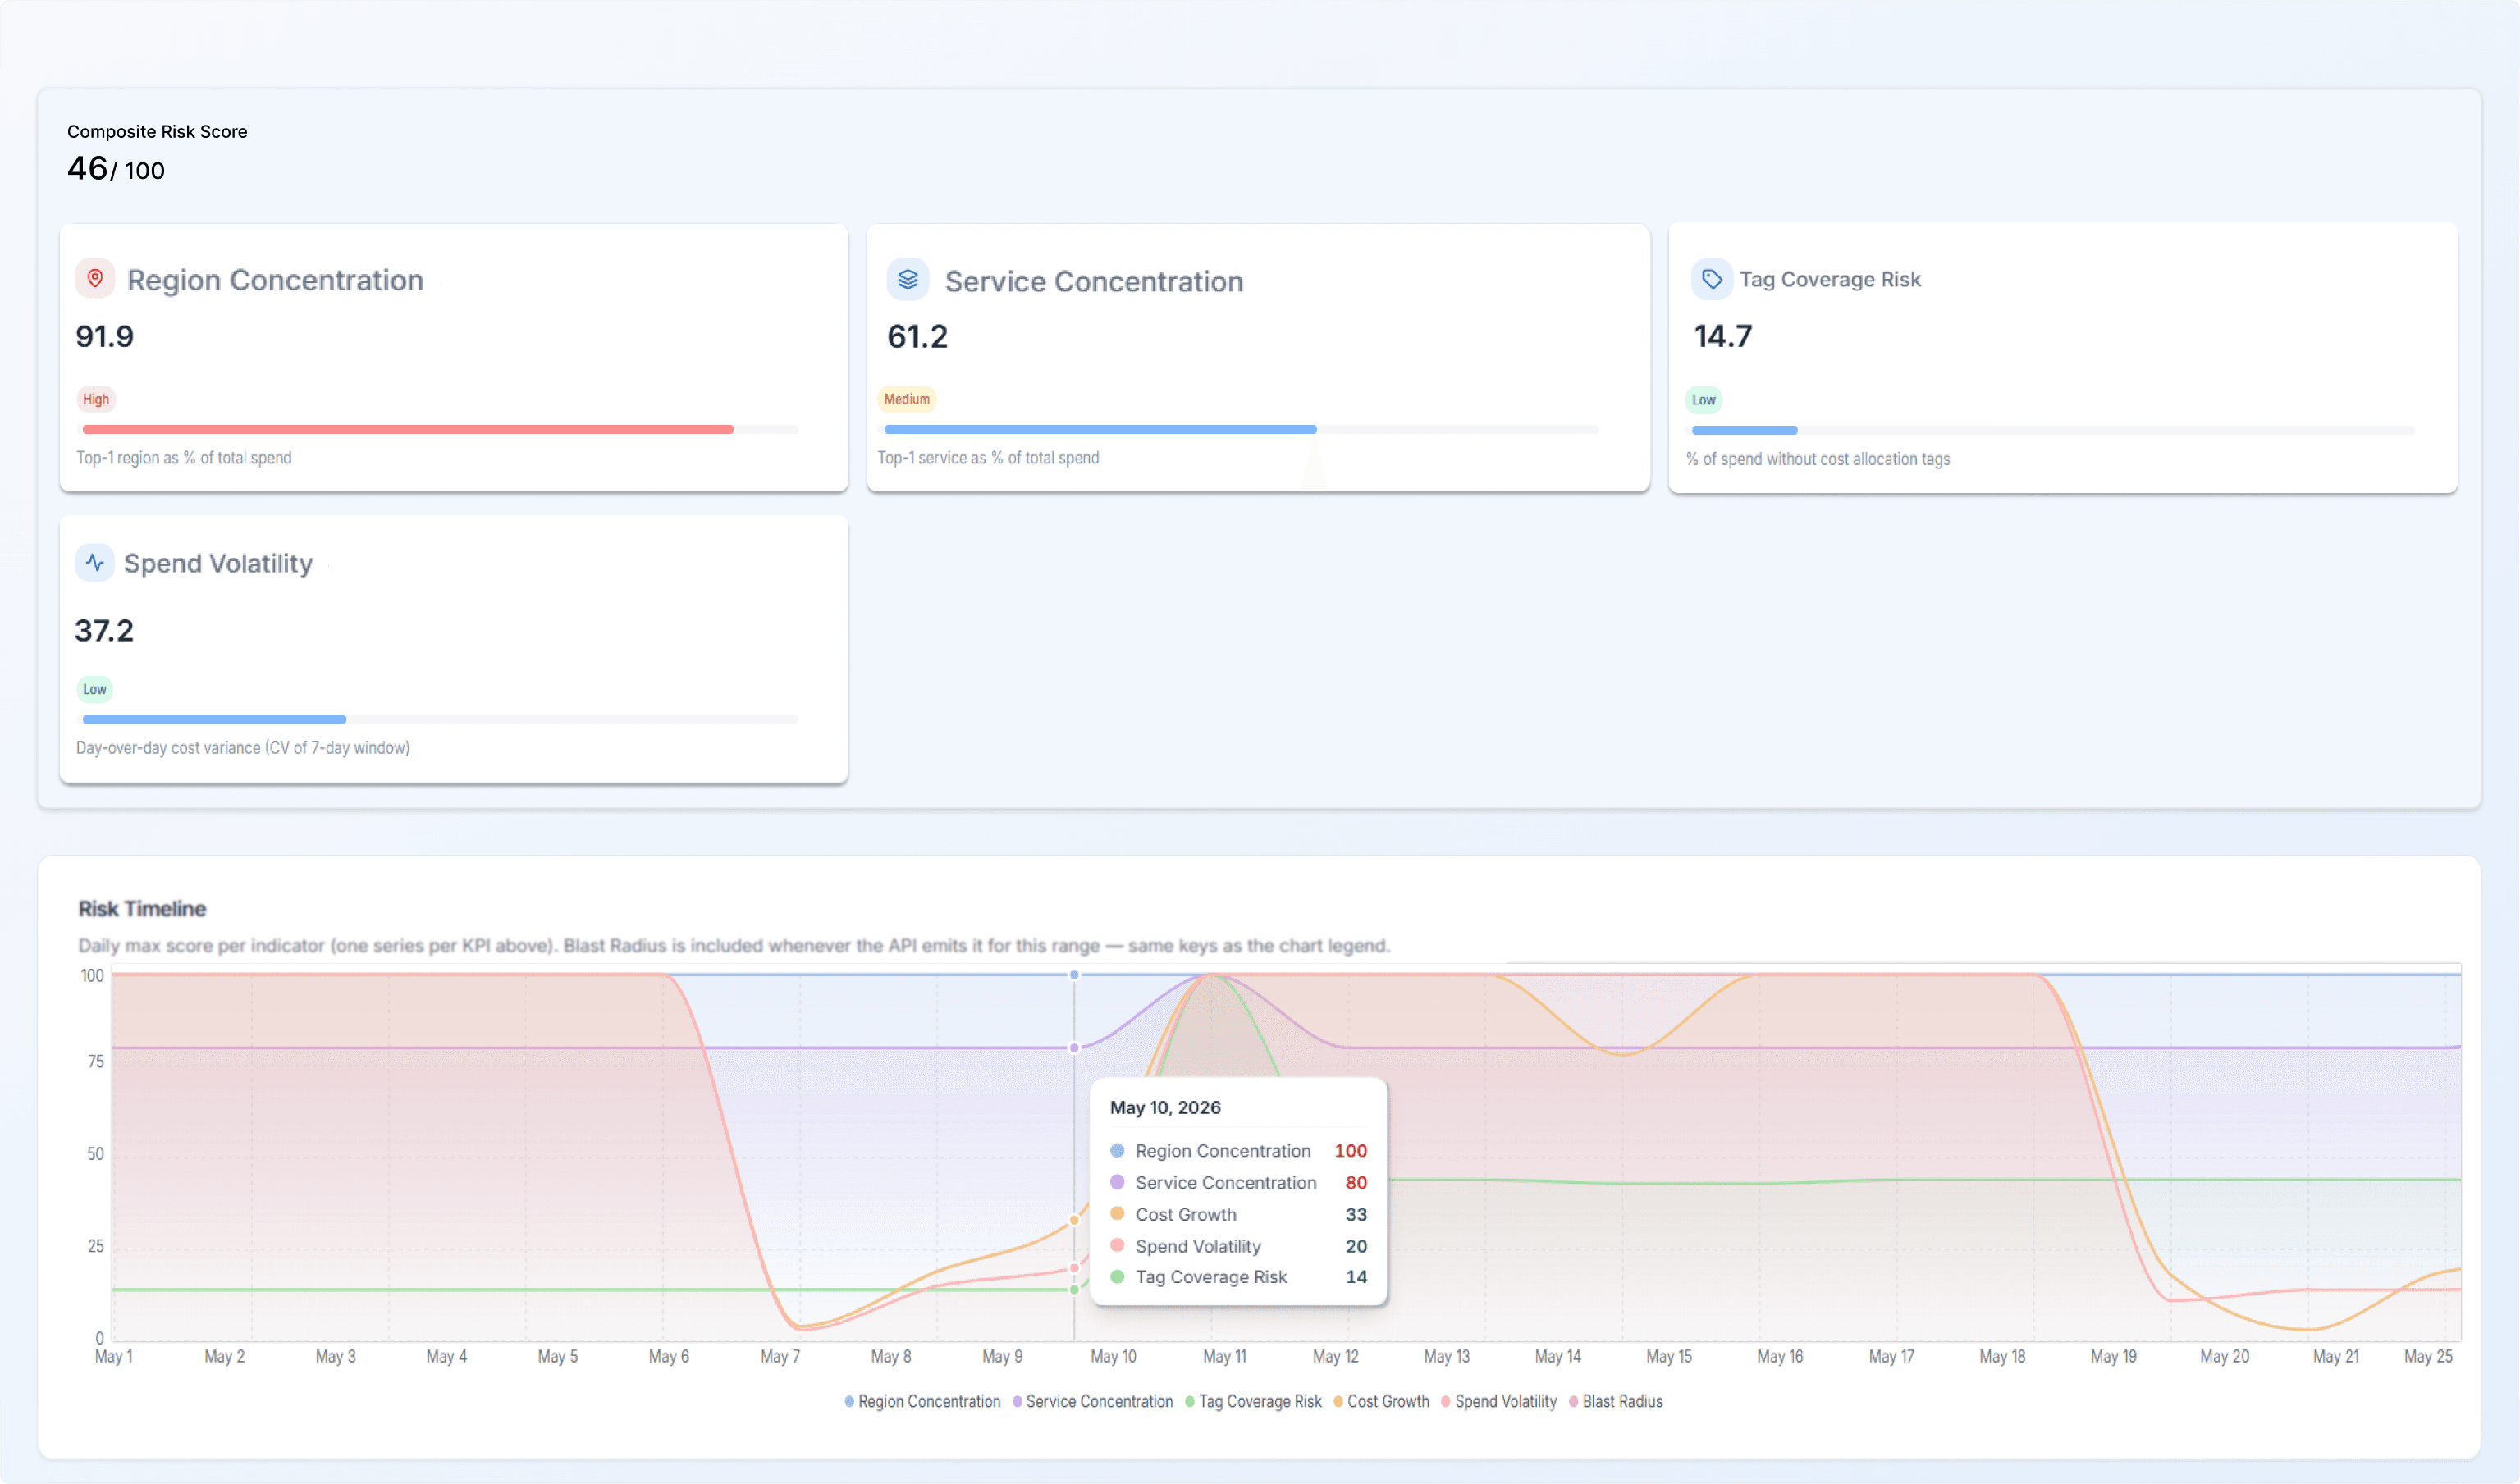
INFORM · RISK SURFACE SCORE
Forcasting
One number that tells you where the financial risk is hiding.
Forecasts you can trust, month after month.
The Risk Surface Score is a single 0–100 number per workload, account, or business unit. It rolls up five signals every CFO cares about and every engineering lead can act on: how volatile the spend is, how steeply it's growing, how concentrated it is in a single service, how concentrated it is in a single region, and how complete the tagging is. Deteriorating scores trigger alerts before they become invoice surprises.
AWS native runs 24-72 hours behind. By then you’ve burned $5-30K. We catch it in 15. The alert pages the right engineer. Resolved by morning, not month-end.
Feature list:
Spend volatility — rolling 30-day variance
Growth slope — current quarter vs trailing 4
Service concentration — single-service exposure (SageMaker, EKS, RDS)
Region concentration — resilience and egress risk
Tag gap — percentage of spend without required cost-allocation tags
Workload-behavior modeling, not simple linear extrapolation
MAPE tracking per workload, per account, per business unit
Volatility flag on unpredictable workloads
Scenario planning: "what if we add a new region?" answered in seconds
OPERATE · TAG GRAPH
Chargeback
The chargeback foundation that finally holds up under audit.
The chargeback line that survives audit.
Tag Graph unifies your sprawl. Project, Proj, ProjectName, project_name — collapsed into one. Inheritance rules push tags from accounts to resources automatically. Virtual tags handle the resources AWS won't let you tag at all. Compliance scoring tells you exactly which teams are out of policy. Every change is logged for audit.
Finance attributes the bill. Engineering asks, "Can you show us why?" Tag Graph unifies tag sprawl, inherits missing tags, fills AWS tagging gaps with virtual tags, and records every change, so the answer is always there.
Feature list:
Tag unification across spelling, casing, and naming variants
Inheritance rules from account → VPC → resource
Virtual tags for un-taggable AWS resources (EKS pods, NAT gateways, data transfer)
Tag compliance scoring per team and per account
Hierarchical chargeback: Org → Dept → Team → App → Service → Env
Full audit trail of who changed which tag, when, and why
Hierarchical roll-up: Org → Dept → Team → App → Service → Env
Tag unification across naming variants (case, spelling, spacing)
Inheritance rules from account → VPC → resource
Virtual tags for un-taggable AWS resources
Full audit trail — who changed which tag, when, and why

Unit Economics
Cost per customer. Cost per product. Ready in 90 days.
Finance attributes the bill. Engineering asks, "Can you show us why?" Tag Graph unifies tag sprawl, inherits missing tags, fills AWS tagging gaps with virtual tags, and records every change, so the answer is always there.
Auto-discovery from EKS, ECS, RDS, EC2 metadata
Five revenue connectors: HTTP, RDS, CSV, Mongo, push
Hierarchical showback (Org → Team → Product → Customer)
Board-ready CSV / PDF export
Cost-per-transaction and cost-per-API-request breakdowns for tech-heavy products
YOUR NUMBER
See how much you could save, 20–40% cloud savings in the first 90 days.
Know your cloud savings before you invest. Estimate annual savings from safe optimization, faster investigations, and anomaly detection using conservative, auditable assumptions.
FROM CONNECT TO CHARGEBACK IN 14 DAYS
Get started with Opsolute in three simple steps
Get started with Opsolute in three simple steps
No SDK integration. No engineering migration. A read-only IAM role, 30 minutes with your platform team, and a defensible chargeback report inside two weeks.
Connect
Link Your AWS Organization
Deploy a read-only IAM role. Opsolute connects to Cost Explorer, CUR, and CloudWatch, 30-minute setup, no agents.
Map
Every dollar attributed
Unify your cloud with Tag Graph. Map dependencies with Cost Cortex. Prioritize risk in just three days.
Operate
Weekly run, quarterly forecast
Align finance and engineering with accurate chargeback, trusted optimization, and shared budget guardrails, in 14 days
Connect
Link Your AWS Organization
Deploy a read-only IAM role. Opsolute connects to Cost Explorer, CUR, and CloudWatch, 30-minute setup, no agents.
Map
Every dollar attributed
Unify your cloud with Tag Graph. Map dependencies with Cost Cortex. Prioritize risk in just three days.
Operate
Weekly run, quarterly forecast
Align finance and engineering with accurate chargeback, trusted optimization, and shared budget guardrails, in 14 days
Faq
The four questions every finance leader asks.
If you have others, book a 30-minute call. We answer the awkward ones directly.
How is Opsolute different from other infrastructure cost intelligence platforms?
Your AWS bill tells you what you spent. Opsolute shows you what drove it. It connects billing data with live infrastructure context across EKS, ENIs, NAT Gateway traffic, load balancers, storage, and workload relationships, giving you the attribution and infrastructure intelligence that billing data alone can't provide
Do I need my engineering team to tag every resource first?
Inconsistent tags shouldn't block chargeback. Tag Graph creates one canonical naming layer, inherits tags from account to VPC to resource, and adds virtual tags for untaggable resources like EKS pods, NAT Gateways, and cross-service data transfer. Get defensible chargeback in 14 days without a quarter of engineering cleanup.
What if my monthly AWS spend is under $50K?
You'd be on the Standard tier, 1% of monthly spend, minimum $99/mo. For a $30K/mo customer, that's $300/mo. You get the full platform (Cost Ledger, Cost Cortex, Tag Graph, safe optimization, anomaly alerting, forecasting), the same tools every larger customer uses. We don't cap features by size. That's the promise.
How does the 1% pricing actually work? Any hidden costs?
Most platforms turn AWS billing data into dashboards. Opsolute combines billing with live infrastructure metadata, including Kubernetes workloads, networking, storage, and resource dependencies, to reveal the relationships behind every cloud dollar. The result is infrastructure-aware attribution, faster investigations, and optimization insights that billing-only platforms simply can't deliver.
How is Opsolute different from other infrastructure cost intelligence platforms?
Your AWS bill tells you what you spent. Opsolute shows you what drove it. It connects billing data with live infrastructure context across EKS, ENIs, NAT Gateway traffic, load balancers, storage, and workload relationships, giving you the attribution and infrastructure intelligence that billing data alone can't provide
Do I need my engineering team to tag every resource first?
Inconsistent tags shouldn't block chargeback. Tag Graph creates one canonical naming layer, inherits tags from account to VPC to resource, and adds virtual tags for untaggable resources like EKS pods, NAT Gateways, and cross-service data transfer. Get defensible chargeback in 14 days without a quarter of engineering cleanup.
What if my monthly AWS spend is under $50K?
You'd be on the Standard tier, 1% of monthly spend, minimum $99/mo. For a $30K/mo customer, that's $300/mo. You get the full platform (Cost Ledger, Cost Cortex, Tag Graph, safe optimization, anomaly alerting, forecasting), the same tools every larger customer uses. We don't cap features by size. That's the promise.
How does the 1% pricing actually work? Any hidden costs?
Most platforms turn AWS billing data into dashboards. Opsolute combines billing with live infrastructure metadata, including Kubernetes workloads, networking, storage, and resource dependencies, to reveal the relationships behind every cloud dollar. The result is infrastructure-aware attribution, faster investigations, and optimization insights that billing-only platforms simply can't deliver.
Stop guessing what your AWS bill will be next quarter.
Connect your AWS Organization in under 30 minutes. Most customers see their first chargeback report in 14 days and realize a 5–10× return on Opsolute within 90 days.