Published by
Opsolute Team
on
Introduction
Here's something I've learned after three years of wrangling cloud bills: the gap between "we track cloud costs" and "we can actually allocate every dollar to a team or product" is where most FinOps initiatives quietly stall.
You've probably been there. Your CFO wants a P&L by product line. Engineering wants to know which microservices are burning budget. But you're stuck reconciling spreadsheets at month-end, estimating shared platform costs, and explaining why 30% of last month's AWS bill is categorized as "unallocated." The vendors promise automated allocation magic. The FinOps Framework gives you a beautiful conceptual model. What you actually need? A battle-tested playbook with worked examples, copy/paste rule snippets, and a realistic timeline.
That's what this guide delivers not theory but tactics. We'll walk through three complete allocation scenarios with real numbers, give you JSON rules you can adapt today, and show you exactly how teams go from 60% to 98% allocation coverage in 8-12 weeks. If you're tired of month-end allocation gymnastics, you're in the right place.
1. What Cloud Cost Allocation Actually Means (And Why It Matters More Than You Think)
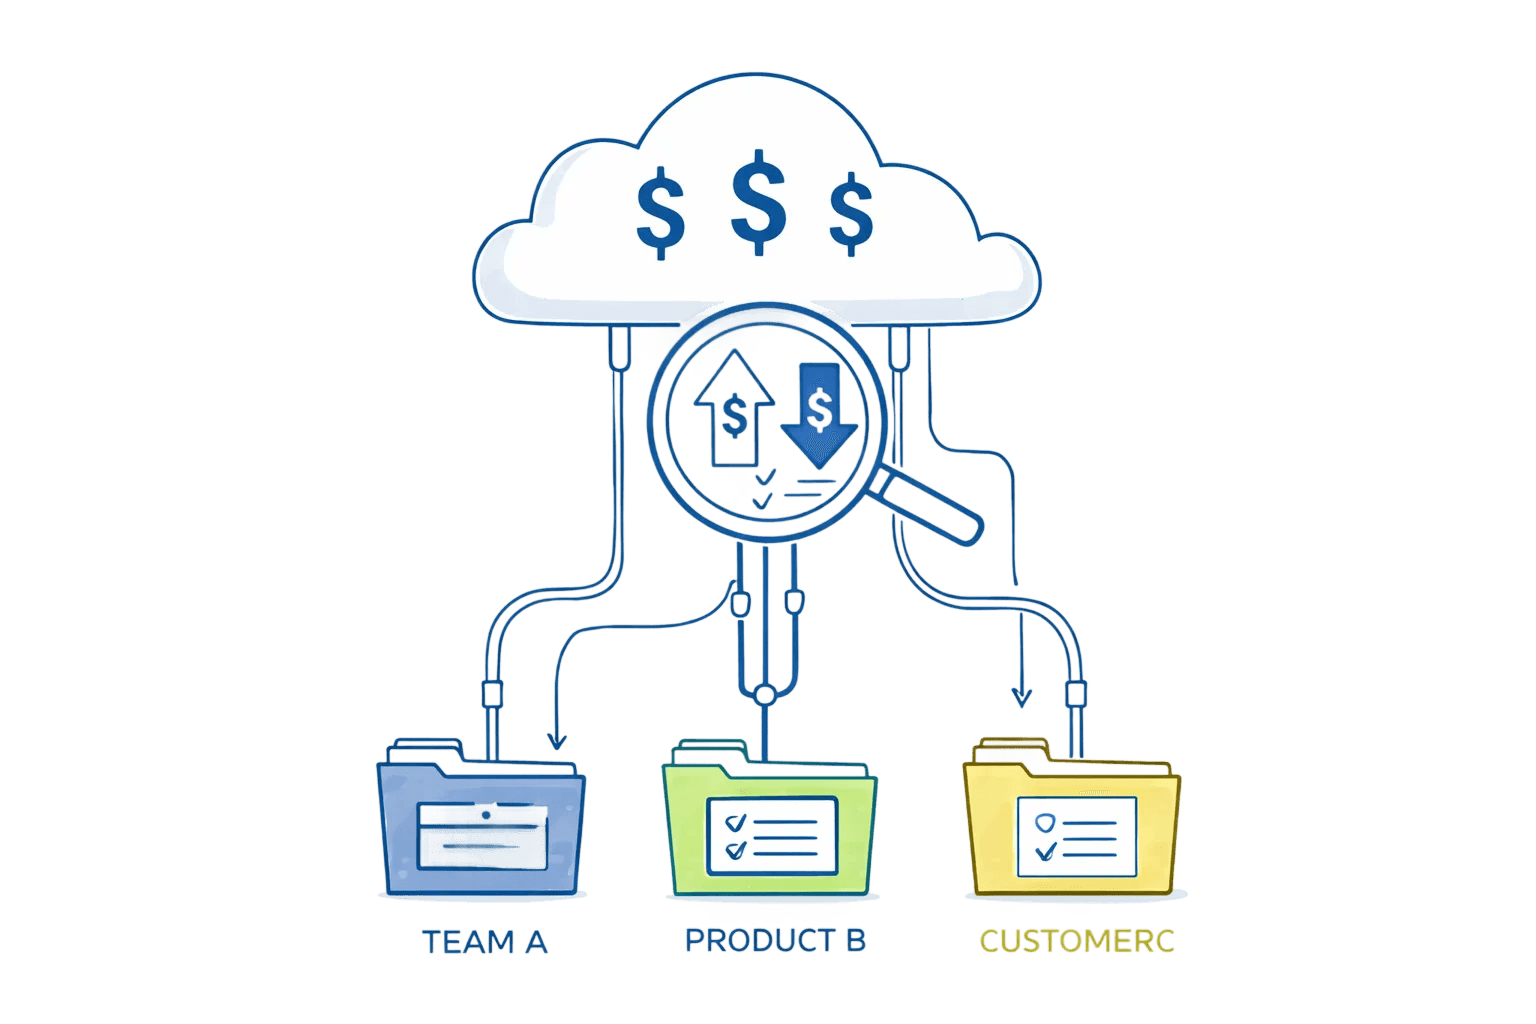
Cloud cost allocation is the process of mapping every line item on your cloud bill compute instances, storage buckets, data transfer, third-party marketplace charges, and yes, even that mysterious "network cross-region data processing fee", to a specific cost center, product, team, or customer.
Simple definition. Complex execution.
Why this matters: Without accurate allocation, you're flying blind. You can't calculate product margins. You can't identify which team's experiment drove a $40K spike in compute last Tuesday. You can't implement meaningful cost accountability because nobody actually owns the costs. And when finance asks "what's our cloud efficiency by business unit," you're stuck with guesswork and quarterly estimates.
The business outcomes of getting allocation right are substantial:
True product P&L: Know if that new AI feature is profitable or subsidized by other products
Accountability at scale: When teams see their costs in weekly dashboards, behavior changes, often by 15-25% within the first quarter
Faster decision-making: Should we migrate that workload? The answer is in your allocated cost data and clear unit cost considerations like cost per customer, feature, or transaction.
Showback and chargeback: Move from "IT is expensive" conversations to "here's exactly what you consumed and why"
According to the FinOps Foundation's allocation guidance, allocation is a core FinOps capability that intersects with nearly every other capability, from forecasting to optimization to rate optimization. You can't mature your FinOps practice without solving allocation first, because accurate ownership is the foundation for forecasting cloud costs with confidence.
The catch: Most organizations plateau at 70-80% allocation coverage. That last 20-30%, shared network costs, platform overhead, untaggable services, legacy resources with missing metadata, becomes the permanent "unallocated" bucket that finance grudgingly accepts and engineering stops caring about.
This guide shows you how to close that gap.
2. Allocation Approaches Compared: Choosing Your Method
Not all allocation is created equal. The method you choose depends on your organizational maturity, tagging discipline, and tolerance for estimation. Here's the landscape:
Tag-Based Allocation (Direct Attribution)
This is the gold standard everyone talks about. Resources are tagged with cost center, team, product, environment metadata. Billing exports respect those tags. Costs flow cleanly to owners.
Pros:
High accuracy when tagging is consistent
Auditable and transparent
Works natively with cloud provider cost allocation tools
Cons:
Requires strong tag governance (spoiler: most orgs don't have this yet)
Can't handle untaggable resources (some network charges, marketplace fees, support plans)
Retroactive tagging doesn't backfill historical costs
Tags get deleted, misspelled, or duplicated, expect 10-15% tag drift without enforcement
Best for: Mature engineering orgs with established tagging policies and automated tag compliance checks.
Usage-Based Proportional Allocation
When you can't tag directly, allocate based on a consumption proxy. For example: split shared data transfer costs proportionally based on each team's EC2 instance-hours, or allocate S3 request costs based on bucket API call volume to enable deeper S3 cost optimization later.
Pros:
Works for untaggable shared costs
Reflects actual usage patterns
Fair distribution when designed correctly
Cons:
Requires defining the "right" proxy metric (not always obvious)
Can be computationally complex for large-scale environments
Needs regular validation, usage patterns shift
Best for: Shared infrastructure, networking costs, platform services consumed by multiple teams.
Fixed Percentage Allocation
The simplest approach: allocate shared costs using a fixed percentage split. For example, platform engineering overhead is split 40% Product A, 35% Product B, 25% Product C based on team size or revenue contribution.
Pros:
Fast to implement
Easy to explain to stakeholders
Low ongoing maintenance
Cons:
Least accurate, doesn't reflect actual consumption changes
Can create perverse incentives (teams that grow subsidize teams that shrink)
Requires quarterly reviews and adjustments
Best for: Truly shared costs with no obvious usage signal (executive overheads, compliance tooling) or as a temporary placeholder while you build better allocation.
Hybrid Model (The Real-World Answer)
Here's what actually works: combine all three. Use tags for directly attributable resources (80% of your bill), proportional rules for shared infrastructure (15%), and fixed splits for the genuinely unallocable remainder (5%). The goal isn't perfection, it's defensible, repeatable, and improvable allocation.
Comparison Table
The takeaway: Start with tags where you have them. Build proportional rules for the obvious shared costs (network, platform services). Use fixed splits sparingly and document why you chose them. Iterate every quarter.
3. Showback vs. Chargeback: Which Path to Accountability?
I've seen organizations rush into chargeback and create internal resentment. I've also seen showback initiatives that nobody pays attention to after the first month. The key is sequencing this correctly.
Showback: Transparency Without Financial Consequence
Showback means publishing allocated costs to teams, dashboards, weekly reports, Slack alerts, but costs remain centralized in the IT budget. Teams see what they're consuming, but their P&L isn't affected.
When to use showback:
You're early in your FinOps journey (tagging quality <80%)
Engineering culture isn't ready for financial accountability
You want to build cost literacy before enforcement
Leadership wants to measure behavior change without disrupting budgets
Sample showback report structure:
Team: Data Platform
Week: Oct 1-7, 2025
Total Cost: $47,350
Breakdown:
- Compute (EC2): $32,100 (68%)
- Storage (S3): $8,900 (19%)
- Data Transfer: $4,200 (9%)
- Other: $2,150 (4%)
Top 3 Resources:
1. prod-ml-training-cluster: $18,400
2. analytics-rds-primary: $6,700
3. archive-s3-glacier: $5,200
Week-over-week: ↑ 12% (+ $5,100)
Pro tip: Include anomaly detection and context in your showback reports. A number without a story is just noise.
Chargeback: Financial Accountability
Chargeback moves costs directly onto team or product budgets. IT becomes a service provider; consumers pay for what they use. This fundamentally changes behavior, usually for the better, sometimes in unexpected ways.
When to use chargeback:
Allocation accuracy is >90% and stable
Tag governance is enforced and automated
Finance and engineering leadership agree on the cost model
You have mechanisms to handle disputes and corrections
Prerequisites for chargeback:
Agreed-upon allocation methodology (documented and socialized)
Monthly reconciliation process
Dispute resolution workflow
Transparent reporting that teams can audit themselves
Executive sponsorship (because somebody will complain)
The gotcha: Chargeback without good data creates more problems than it solves. I've watched teams get hit with surprise $30K bills due to allocation rule bugs, only to lose trust in the entire FinOps program. Start with showback. Prove your allocation is accurate and stable for 2-3 months. Then graduate to chargeback.
Hybrid approach: Some organizations use showback for shared/platform costs (where precision is harder) and chargeback for direct, well-tagged resource costs. This gives you accountability where you're confident and transparency elsewhere.
4. Worked Examples: Allocation Math with Real Numbers
Theory is fine. Let's get practical. Here are three complete allocation scenarios you can adapt to your environment.
Example A: Simple Proportional Split for Shared Network Costs
Scenario: Your AWS account has $12,000 in monthly data transfer charges. These aren't tagged (though AWS offer network tagging but the process can be complex because network costs are often tied to multiple services). You need to allocate them to three product teams: Alpha, Beta, and Gamma.
Usage proxy: Each team's EC2 instance-hours as a measure of workload activity.
Step 1: Gather usage data
Alpha Team: 45,000 EC2 instance-hours
Beta Team: 30,000 EC2 instance-hours
Gamma Team: 25,000 EC2 instance-hours
Total: 100,000 EC2 instance-hours
Step 2: Calculate proportional weights
Alpha: 45,000 / 100,000 = 45%
Beta: 30,000 / 100,000 = 30%
Gamma: 25,000 / 100,000 = 25%
Step 3: Allocate the $12,000 network cost
Alpha: $12,000 × 0.45 = $5,400
Beta: $12,000 × 0.30 = $3,600
Gamma: $12,000 × 0.25 = $3,000
Total: $12,000 (100% allocated)
JSON allocation rule example:
{
"ruleName": "network-transfer-proportional-by-compute",
"ruleType": "proportional",
"sourceCharges": {
"service": "AmazonEC2",
"usageType": "DataTransfer-Out-Bytes"
},
"allocationMethod": "usage_proxy",
"proxy": {
"metric": "EC2_InstanceHours",
"aggregationPeriod": "monthly"
},
"targets": [
{"team": "Alpha", "weight": "dynamic"},
{"team": "Beta", "weight": "dynamic"},
{"team": "Gamma", "weight": "dynamic"}
]
}
Validation: Does this pass the smell test? Alpha runs the largest workload, so getting 45% of network costs makes sense. Next month, if Alpha scales down, their allocation will automatically adjust based on updated EC2 hours.
Example B: Tag-Based Allocation with Imperfect Tagging and Backfill
Scenario: You have a $85,000 monthly EC2 bill. 70% of instances are properly tagged with CostCenter. The remaining 30% are legacy instances with missing or incorrect tags.
Step 1: Calculate directly tagged costs
Total EC2 cost: $85,000
Tagged resources (70%): $59,500
Untagged resources (30%): $25,500
Step 2: Allocate tagged resources
Export your billing data filtered by tag CostCenter:
CostCenter: Engineering $28,000 (47% of tagged)
CostCenter: DataScience $18,500 (31% of tagged)
CostCenter: ProductDev $13,000 (22% of tagged)
Step 3: Backfill untagged costs using account/region heuristic
Analyze untagged resources and find that:
60% are in the
prod-dataAWS account (historically owned by DataScience)25% are in
prod-appaccount (ProductDev)15% are in shared accounts (Engineering platform)
Apply those ratios to the $25,500 untagged pool:
DataScience backfill: $25,500 × 0.60 = $15,300
ProductDev backfill: $25,500 × 0.25 = $6,375
Engineering backfill: $25,500 × 0.15 = $3,825
Step 4: Final allocation
Engineering: $28,000 (tagged) + $3,825 (backfill) = $31,825
DataScience: $18,500 (tagged) + $15,300 (backfill) = $33,800
ProductDev: $13,000 (tagged) + $6,375 (backfill) = $19,375
Total: $85,000 (100% allocated)
Governance action: Tag the untagged instances. Next month, aim for 85% tag coverage. Track this as a KPI.
JSON rule for backfill:
{
"ruleName": "ec2-untagged-backfill-by-account",
"ruleType": "conditional",
"condition": {
"tagKey": "CostCenter",
"operator": "missing"
},
"allocationMethod": "account_mapping",
"mappings": [
{"account": "prod-data", "target": "DataScience", "percentage": 100},
{"account": "prod-app", "target": "ProductDev", "percentage": 100},
{"account": "shared-infra", "target": "Engineering", "percentage": 100}
]
}
Example C: Mixed Model for Platform Overhead Across Products
Scenario: Your platform engineering team runs shared services (Kubernetes control plane, centralized logging, CI/CD infra) costing $22,000/month. You need to allocate this to three product lines: Product A, Product B, and Product C.
Allocation approach: Hybrid, part fixed, part proportional.
Step 1: Break down platform costs
Shared Kubernetes control plane: $10,000 (proportional by pod count)
Centralized logging (ELK stack): $7,000 (proportional by log volume GB)
CI/CD infrastructure: $5,000 (fixed split by number of repos)
Step 2: Gather usage metrics
Kubernetes pod count (monthly average):
Product A: 120 pods
Product B: 80 pods
Product C: 50 pods
Total: 250 pods
Log volume ingested (monthly):
Product A: 4,500 GB (56%)
Product B: 2,200 GB (28%)
Product C: 1,300 GB (16%)
Total: 8,000 GB
CI/CD repos:
Product A: 15 repos (50%)
Product B: 10 repos (33%)
Product C: 5 repos (17%)
Total: 30 repos
Step 3: Calculate allocated costs
Kubernetes ($10,000):
Product A: $10,000 × (120/250) = $4,800
Product B: $10,000 × (80/250) = $3,200
Product C: $10,000 × (50/250) = $2,000
Logging ($7,000):
Product A: $7,000 × 0.56 = $3,920
Product B: $7,000 × 0.28 = $1,960
Product C: $7,000 × 0.16 = $1,120
CI/CD ($5,000):
Product A: $5,000 × 0.50 = $2,500
Product B: $5,000 × 0.33 = $1,650
Product C: $5,000 × 0.17 = $850
Step 4: Totals
Product A: $4,800 + $3,920 + $2,500 = $11,220
Product B: $3,200 + $1,960 + $1,650 = $6,810
Product C: $2,000 + $1,120 + $850 = $3,970
Total: $22,000 (100% allocated)
Result: Product A, with the largest workload and log volume, bears 51% of platform overhead. Fair? Debate it with your stakeholders, but now you have a defensible, repeatable model.
5. Allocation Rule Library: Copy/Paste Snippets
Here's a starter library of allocation rules you can adapt. These are vendor-agnostic patterns, map them to your tooling's syntax.
Rule 1: Even Split
Allocate evenly across N targets.
{
"ruleName": "shared-security-tools-even-split",
"description": "Allocate GuardDuty/SecurityHub costs evenly across all products",
"sourceCharges": {
"service": ["Amazon GuardDuty", "AWS Security Hub"]
},
"allocationMethod": "even_split",
"targets": ["ProductA", "ProductB", "ProductC", "ProductD"]
}
This rule takes shared costs (like tool costs) and splits them equally among all four products. If the bill is $1,000, each product gets charged $250. Simple math: divide the total cost by the number of products.
When to use: Costs that truly benefit all teams equally (security, compliance tooling).
Rule 2: Percentage Split
Allocate based on predefined percentages.
{
"ruleName": "executive-overhead-allocation",
"description": "CTO office cloud costs allocated by product revenue contribution",
"sourceCharges": {
"account": "cto-sandbox"
},
"allocationMethod": "fixed_percentage",
"targets": [
{"name": "ProductA", "percentage": 45},
{"name": "ProductB", "percentage": 35},
{"name": "ProductC", "percentage": 20}
],
"reviewCadence": "quarterly"
}
This rule allocates fixed percentages of the cloud costs to each product based on predefined business metrics such as revenue contribution, team size, or customer base size. Product A is assigned 45%, Product B 35%, and Product C 20%. These allocation ratios remain constant month over month and are reviewed and adjusted, if necessary, on a quarterly basis.
When to use: Costs loosely correlated to business metrics (revenue, headcount).
Rule 3: Proportional by Tag Occurrence
Allocate based on how often resources appear under each tag value.
{
"ruleName": "s3-untagged-by-account-history",
"description": "Backfill untagged S3 costs proportionally to historical tag ratios",
"sourceCharges": {
"service": "Amazon S3",
"condition": {"tagKey": "Team", "operator": "missing"}
},
"allocationMethod": "proportional_by_tag_history",
"historicalPeriod": "90_days",
"fallbackTarget": "UnallocatedPool"
}
This rule allocates untagged S3 storage costs by analyzing historical ownership patterns. It examines the past 90 days of tagged S3 resources to determine each team’s proportional usage. Untagged costs are then distributed accordingly. For example, if Team Alpha historically owned 60% of tagged S3 buckets, they are assigned 60% of the untagged S3 costs.
When to use: Backfilling costs for resources with missing tags.
Rule 4: Proportional by Usage Metric
Allocate based on a consumption signal.
{
"ruleName": "rds-shared-proxy-allocation",
"description": "Allocate RDS Proxy costs by number of connections per team",
"sourceCharges": {
"service": "Amazon RDS",
"usageType": "ProxyUsage"
},
"allocationMethod": "usage_proxy",
"proxy": {
"metric": "DatabaseConnections",
"dimension": "DBClusterIdentifier",
"aggregationPeriod": "daily"
},
"targets": ["TeamAlpha", "TeamBeta", "TeamGamma"]
}
This rule allocates the cost of a shared database proxy based on actual usage. It tracks telemetry metrics for each team during the month, then splits the proxy cost proportionally. If Team Alpha accounts for 50% of the usage metrics, they get charged 50% of the proxy cost. Fair allocation based on who used it most.
When to use: Shared infrastructure where usage metrics are available.
6. Handling Untaggable and Shared Costs: Practical Approaches
This is where allocation gets messy, and where most teams give up. Let's tackle the common culprits.
Problem 1: AWS Data Transfer Costs (Untaggable)
Challenge: AWS doesn’t have a direct option to tag network egress, cross-region transfer, or certain CloudFront charges.
Solution: Proportional allocation based on network activity volume of EC2 instance, Lambda invocations, or S3 API requests (depending on your workload). See Example A above for the math.
Alternative: If you run multiple VPCs or accounts per team, allocate network costs by VPC/account. This is less precise but administratively simple.
Governance: Monitor network costs as a % of total spend. If they're growing faster than your compute footprint, investigate, don't just allocate blindly.
Problem 2: Marketplace and Third-Party SaaS Charges
Challenge: You pay for Datadog, MongoDB Atlas, or Snowflake through AWS Marketplace. These charges appear on your AWS bill but often lack team metadata.
Solution:
Tag the subscription at purchase time if the vendor supports it (some do, most don't)
If untagged, map by account or project (if your org uses separate AWS accounts per team, this is easy)
For truly shared tools (e.g., company-wide Datadog), use a proportional split by headcount or application count
Example:
Datadog monthly bill: $8,000
Team breakdown from 75 monitored hosts:
- Engineering: 45 hosts (60%)
- Data Platform: 20 hosts (27%)
- SRE: 10 hosts (13%)
Allocated cost:
- Engineering: $4,800
- Data Platform: $2,160
- SRE: $1,040
Problem 3: Platform Engineering Overhead
Challenge: Your platform team runs shared Kubernetes clusters, CI/CD, observability stacks. How do you allocate their $50K/month in costs?
Solution: Multi-proxy allocation. Use pod count for Kubernetes, log volume for observability, repo count for CI/CD. Update proxies quarterly.
Governance tip: Publish a "platform service catalog" showing what's shared and how it's allocated. Transparency reduces disputes.
Problem 4: Legacy Resources with Missing Tags
Challenge: 500 EC2 instances launched 3 years ago with zero metadata.
Short-term fix: Backfill using account, region, or naming pattern heuristics (see Example B).
Long-term fix:
Implement tag enforcement policies (AWS Config Rules, Azure Policy, GCP Organization Policies)
Run a tagging sprint, automate tag application using account/VPC/name inference
Set up tag compliance dashboards and hold teams accountable
Pragmatic truth: You'll never get to 100% perfect tagging. That's fine. Get to 90%, allocate the rest with rules, and move on.
7. Tooling Options and Decision Matrix
Now the inevitable question: spreadsheets, cloud-native tools, or third-party platforms?
Option 1: Manual Spreadsheets
How it works: Export billing CSVs, pivot in Excel or Google Sheets, apply formulas, distribute reports.
Pros:
Zero tooling cost
Full control
Works for small orgs (<$50K/month cloud spend)
Cons:
Time-consuming (10-20 hours/month)
Error-prone
Doesn't scale
No real-time visibility
Can't handle complex rules
Best for: Startups, proof-of-concept, or temporary gaps before investing in tooling.
Option 2: Cloud-Native Services
AWS Cost Allocation Tags + Cost Explorer: Tag-based allocation with basic reporting.
Azure Cost Management: Allocation rules, budgets, and chargeback.
Google Cloud Billing Reports: Labels and custom filters.
Pros:
Free (included with cloud services)
Native integration
Good for single-cloud environments
Straightforward tag-based allocation
With clear cost ownership in place, cloud cost forecasting spend becomes far more accurate and predictable.
Cons:
Limited rule complexity (no advanced proportional logic in some cases)
Multi-cloud requires separate tools
Reporting UX varies
Can't easily handle untaggable or shared costs
Best for: Single-cloud with strong tag discipline and simple allocation needs.
Option 3: Third-Party Allocation Platforms
Examples: Opsolute, CloudZero, Ternary,, Holori, Kubecost (for Kubernetes-specific)
Pros:
Automated mapping and virtual tags
Advanced rule engines (proportional, waterfall, multi-proxy)
Multi-cloud support
Pre-built integrations
Handles untaggable costs elegantly
Real-time dashboards and alerting
Cons:
Learning curve
Integration effort
Vendor lock-in
Best for: Enterprises, multi-cloud environments, teams with complex allocation scenarios and insufficient engineering bandwidth to build custom tooling.
Decision Matrix
Criteria | Manual Spreadsheets | Cloud-Native Tools | Third-Party Platforms |
Multi-cloud | Painful | No | Yes |
Allocation complexity | Hard | Moderate | Moderate |
Time to value | Weeks | Weeks | Days |
Accuracy | 70-80% | 80-90% | 90+ |
Ongoing effort | High (manual) | Medium | Low |
Auditability | Manual exports | Built-in | Built-in + APIs |
Untaggable cost handling | Manual Rules | Limited | Advanced |
Pragmatic advice: Don't over-engineer early. Start with cloud-native tools and spreadsheets for 90 days. Identify where manual work is painful. Then invest in the right platform for your needs.
In many cases, simply allocating costs to the right teams surfaces quick savings opportunities like idle resources and oversized instances.
Evaluation checklist for third-party platforms:
When you're ready to evaluate (typically at the $200K+/month spend level), test these scenarios:
Upload a sample billing export: how long to first allocated report?
Create a proportional allocation rule for network costs: can you do it without custom code?
Handle untagged resources: does it auto-suggest mappings or require manual rules?
Multi-cloud coverage: if you run AWS + Azure, can you get unified allocation?
Integration depth: can it pull metadata from Kubernetes, service mesh, or APM tools to improve allocation accuracy?
If you're evaluating platforms and want to see how the allocation examples in this guide would work in production, check out Opsolute .
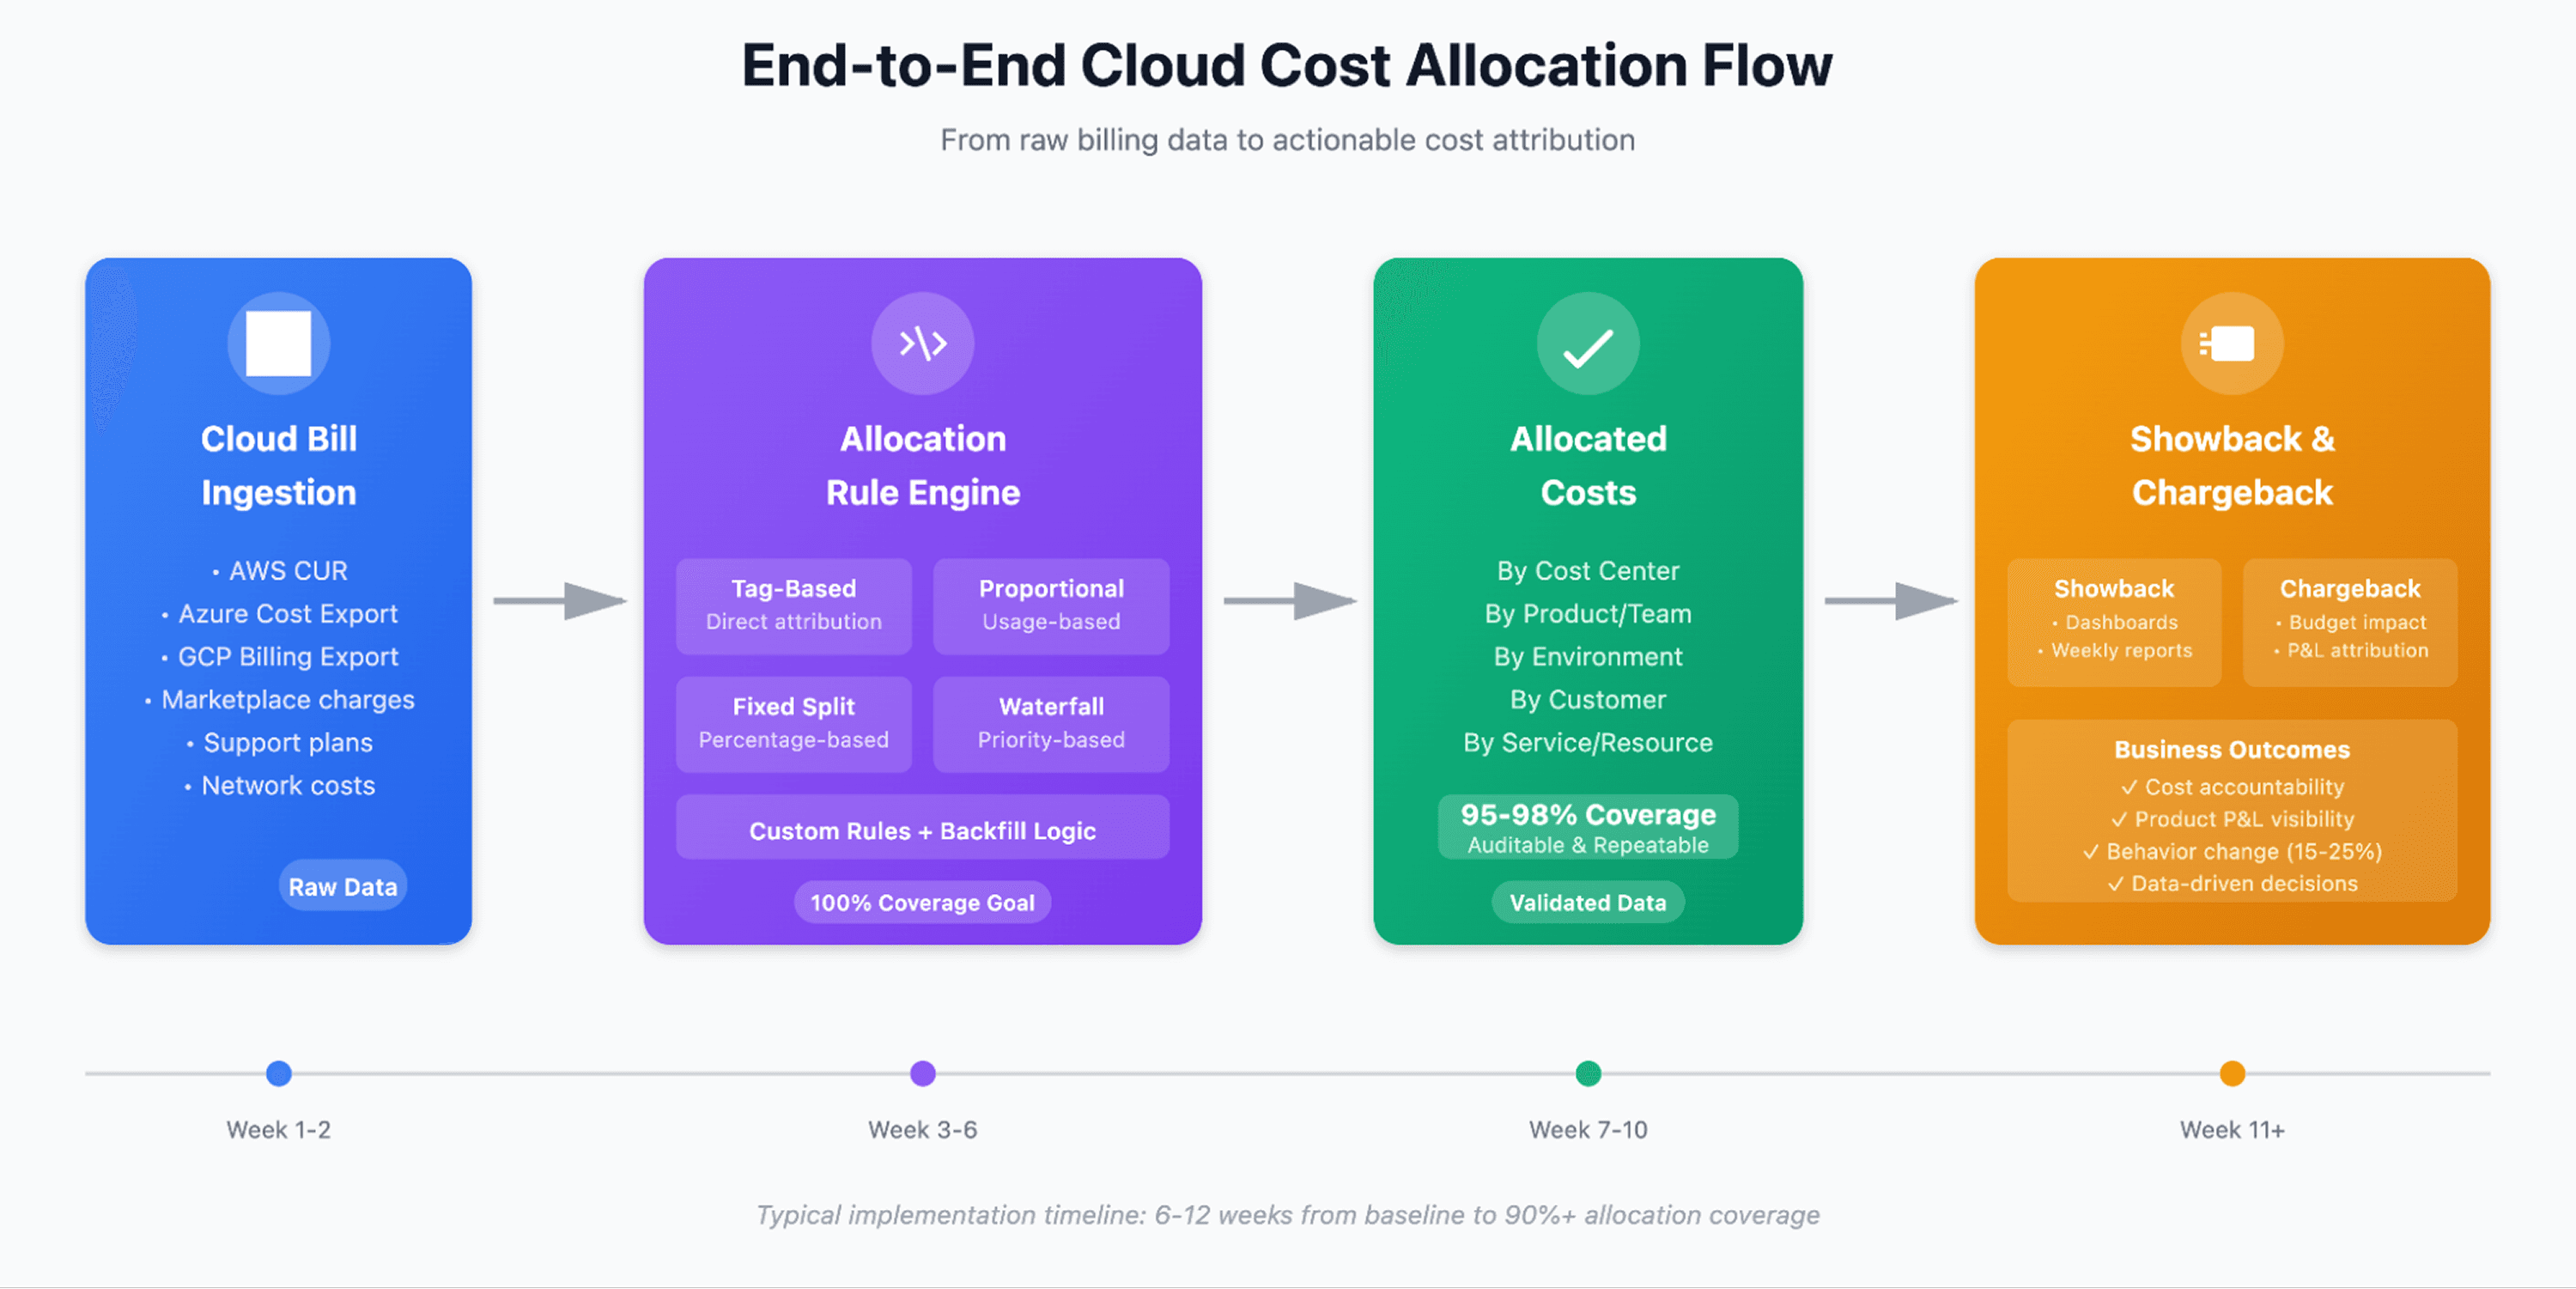
8. Implementation Roadmap: Your 8-12 Week Playbook
Here's a realistic timeline from "we have no allocation" to "we have repeatable, auditable, 90%+ allocation."
Cloud cost allocation implementation timeline showing 6-12 week(based on team size) roadmap from discovery to 90% allocation coverage with effort estimates and key milestones. Cost allocation also makes it easier to calculate cloud unit economics, helping you understand exactly what each customer, feature, or transaction truly costs.
Week 1-2: Discovery & Baseline
Owner: FinOps Lead + Finance
Activities:
Export last 3 months of billing data
Calculate current allocation coverage (what % of costs are tagged/mapped?)
Identify top 10 cost categories by value
Interview stakeholders: what allocation questions do they need answered?
Document current pain points (manual effort, unallocated buckets, disputes)
Deliverable: One-page status summary with baseline metrics and stakeholder requirements.
Effort: 10-15 hours
Week 3-4: Taxonomy & Tagging Improvements
Owner: Cloud Engineering + Platform Team
Activities:
Define or refine tag schema (mandatory keys:
CostCenter,Team,Product,Environment)Audit existing tags: what % of resources are compliant?
Run a tagging sprint: bulk-apply tags using AWS Resource Groups Tagging API, Azure CLI, or GCP scripts
Implement tag enforcement (Config Rules, policy-as-code)
Document tag governance policy
Deliverable: Tag compliance report showing improvement (e.g., 55% → 75% compliant approx).
Effort: 20-30 hours (plus automation scripting time)
Week 5-6: Rule Library Creation
Owner: FinOps Lead
Activities:
Design allocation rules for top 5 unallocated cost categories (see Rule Library section above)
Write JSON or configure rules in your chosen tool
Document rationale for each rule
Validate rules with sample data
Get stakeholder sign-off on allocation methodology
Deliverable: Allocation rule library (JSON or tool config) with documented assumptions.
Effort: 15-20 hours
Week 7-8: Pilot Allocation & Reporting
Owner: FinOps Lead + Finance
Activities:
Run allocation for a single month using rules
Generate showback reports for 2-3 pilot teams
Review reports with team leads: does this make sense?
Iterate on rules based on feedback
Fix obvious errors (wrong account mappings, bad proxies)
Deliverable: Pilot showback reports + feedback log.
Effort: 10-15 hours
Week 9-10: Validation & Reconciliation
Owner: Finance + FinOps Lead
Activities:
Compare allocated costs to actual cloud bill (should equal 100%)
Reconcile discrepancies (credits, refunds, rounding errors)
Document any unallocated residuals and create backlog issues to address them
Run allocation for 2nd month to confirm repeatability
Deliverable: Reconciliation report showing 90%+ allocation coverage.
Effort: 8-12 hours
Week 11: Stakeholder Training & Rollout
Owner: FinOps Lead
Activities:
Present allocation methodology to leadership
Train team leads on how to read reports and drill into costs
Publish self-service dashboards
Announce transition from "no allocation" to "showback" (or "chargeback" if you're ready)
Deliverable: Training deck + recorded walkthrough.
Effort: 5-8 hours
Week 12: Policy Enforcement & Documentation
Owner: FinOps Lead + Cloud Governance
Activities:
Publish allocation policy (who owns what, how rules are updated, dispute process)
Schedule quarterly rule review meetings
Set up alerting for allocation anomalies (sudden spikes, missing tags)
Document runbooks for common issues
Deliverable: Allocation policy doc + runbook.
Effort: 6-10 hours
Ongoing (Post-Week 12)
Monthly: Review unallocated %, tag compliance %, and cost anomalies
Quarterly: Validate allocation rules and adjust proxies
Annually: Reassess tooling needs and conduct allocation audit
Total estimated effort: 80-120 hours over 12 weeks (roughly 7-10 hours/week for a dedicated FinOps lead).
Key success metrics:
Allocation coverage: Target 90%+ by week 10
Tag compliance: Target 85%+ by week 4
Stakeholder satisfaction: Survey team leads monthly
Once storage costs are allocated correctly, teams can dive deeper into S3 cost optimization to cut waste from unused or infrequently accessed data.
9. Case Study: From 60% to 95% Allocation in 3 Weeks
Let me share a real (anonymized) example from a mid-sized SaaS company we worked with at Opsolute.
Starting point:
$380,000/month multi-cloud spend
60% allocation coverage
15+ hours/month of manual allocation work
Finance unable to produce product-level P&L
Problems identified:
35% of resources had missing or inconsistent tags
Network and shared infrastructure costs were unallocated
No visibility into which teams owned orphaned resources
Savings recommendations weren't attributed to any team
Actions taken (Weeks 1-3):
Week 1: Used Opsolute's Resources Inventory to identify untagged resources across their environment. The Tag Recommender suggested appropriate tags based on resource naming patterns and account groupings, which helped them quickly organize resources by team and product. Tag coverage dashboard showed real-time progress from 55% to 78% compliance.
Week 2: Built allocation rules in Opsolute's Chargeback module for network costs and platform services. Set up automated showback reports that teams could access directly through the dashboard. The allocation engine handled the calculations automatically each month.
Week 3: Reviewed allocated costs with department leads using the Intelligent Showback view. Made a few rule adjustments captured in the audit trail. The reconciliation dashboard confirmed that allocated totals matched actual cloud bills.
Results (Month 2):
95% allocation coverage tracked in the dashboard; remaining gaps clearly visible for follow-up
Manual effort reduced to ~3 hours/month for reviewing outputs and handling exceptions
Tag compliance at 88% as teams could see their untagged resources immediately
Behavior changes:
Teams identified idle resources flagged by Cost Optimization recommendations and decommissioned them
Budget Guardrails helped teams stay on track as they could now see their actual spend
Finance produced its first product, P&L, using cost attribution exports
Bottom line:
Time saved annually: ~150 hours
Cost avoidance from optimization decisions: ~$35K/year
ROI: System paid for itself within the first quarter
What made the difference: Having visibility, automated allocation, and audit trails in one platform meant allocation became a repeatable process instead of a monthly manual exercise.
10. Governance, KPIs, and Validation
Allocation isn't "set it and forget it." You need ongoing governance to maintain accuracy and trust.
Key Metrics to Track
KPI | Target | Frequency | Owner |
Allocation Coverage | >90% | Monthly | FinOps Lead |
Tag Compliance | >85% | Weekly | Cloud Engineering |
Unallocated Spend | <$5K or <2% | Monthly | Finance |
Allocation Rule Count | Document all rules | Quarterly review | FinOps Lead |
Mean Time to Reconcile | <4 hours | Monthly | Finance + FinOps |
Dispute Rate | <3 per month | Monthly | FinOps Lead |
Manual Effort Hours | Minimize | Monthly | FinOps Lead |
Quarterly Validation Audit
Every quarter, run a validation audit:
Reconciliation Check: Do allocated costs sum to 100% of the cloud bill?
Rule Review: Are allocation proxies still accurate? (Usage patterns change.)
Tag Drift Analysis: What % of new resources are untagged?
Stakeholder Feedback: Survey team leads on allocation accuracy and usefulness
Update Rules: Adjust fixed percentages, recalibrate proportional weights
Sample query to find unallocated costs:
-- For AWS Cost and Usage Report in Athena
SELECT
line_item_product_code,
SUM(line_item_unblended_cost) AS unallocated_cost
FROM cur_database.cur_table
WHERE resource_tags_user_cost_center IS NULL
AND line_item_usage_start_date >= DATE('2026-10-01')
GROUP BY line_item_product_code
ORDER BY unallocated_cost DESC
LIMIT 10;
Governance Best Practices
Document everything: Every rule should have a written rationale
Version control: Track allocation rule changes (treat rules like code)
Dispute process: Define how teams can challenge allocations (SLA: 5 business days)
Transparency: Publish allocation methodology internally so teams can audit their own costs
Review cadence: Quarterly rule reviews + ad hoc as needed
11. FAQ & Troubleshooting
What does 100% allocation mean, and is it always achievable?
100% allocation means every dollar on your cloud bill is assigned to a cost center, product, or team no "unallocated" buckets. It's achievable with a combination of tags, usage-based proportional rules, and allocation rules for untaggable/shared spend. Some residuals may remain temporarily (credits, refunds, one-time charges), but with proper backfill and estimation practices, you can consistently hit 95-98% coverage. The last 2-5% is often diminishing returns don't let perfection block progress.
How do I allocate shared costs like networking or platform services?
Use proportional allocation based on a consumption proxy. For networking, allocate by EC2 instance-hours or data-generating service API calls. For platform services (Kubernetes, logging, CI/CD), allocate by pod count, log volume, or repo count respectively. If no good proxy exists, use fixed percentage splits based on team size or revenue contribution. The key: document your logic and review it quarterly as usage patterns evolve.
Showback vs chargeback which should my organization start with?
Start with showback. This builds cost literacy and transparency without the political complexity of financial enforcement. Run showback for 2-3 months while improving tag compliance and stabilizing allocation rules. Graduate to chargeback once:
Allocation accuracy is >90% and stable
Tag governance is enforced
Finance and engineering agree on the cost model
You have a dispute resolution process
Rushing into chargeback with bad data destroys trust. Be patient.
What do I do about resources that can't be tagged or are missing tags?
Untaggable resources: Use allocation rules with usage proxies (see examples in Section 6). For network costs, allocate by compute footprint. For marketplace SaaS, allocate by account or headcount.
Missing tags: Backfill using account ID, region, or resource naming patterns (see Example B). Then fix the root cause: implement tag enforcement policies (AWS Config Rules, Azure Policy, GCP Organization Policy) and schedule a tagging sprint to catch up legacy resources.
Treat untagged spend as a KPI, if it's growing, you have a governance problem.
Which KPIs should FinOps teams track after implementing allocation?
The essentials:
Allocation coverage % (target: >90%)
Unallocated spend $ (target: <$5K or <2% of total)
Tag compliance % (target: >85%)
Number of allocation rules (track for complexity management)
Time to reconcile allocation differences (target: <4 hours/month)
Manual effort hours (measure to prove ROI)
Dispute rate (target: <3/month)
Business-level KPIs enabled by allocation:
Cost per customer
Product margin by SKU
Cost efficiency ratio (revenue per $ cloud spend)
Should we use vendor tooling or a third-party allocation platform?
It depends on scale and complexity:
Use cloud-native tools if:
Single-cloud environment
Simple tag-based allocation
Strong tag discipline already exists
Budget-conscious (they're free)
Use third-party platforms if:
Multi-cloud (AWS + Azure + GCP)
Complex shared cost scenarios
Need advanced rule engines (proportional, waterfall, multi-proxy)
$500K/month cloud spend (ROI justifies cost)
The engineering team lacks bandwidth to build custom tooling
Evaluate using the decision matrix in Section 7. Start with cloud-native for 90 days. If you're spending more than 10 hours/month fighting tooling limitations, upgrade to a third-party.
How long does it take to implement an automated allocation framework?
Pilot (basic rules + reporting): 2-4 weeks
Full rollout (policy, governance, stakeholder training): 8-12 weeks
Timeline depends on:
Current tag compliance (low compliance adds 2-4 weeks for tagging sprint)
Organizational size (larger = more stakeholder alignment needed)
Tooling choice (cloud-native is faster, third-party has learning curve)
FinOps team capacity (expect 7-10 hours/week from FinOps lead)
Use the roadmap in Section 8 as your baseline.
Common Error: My allocation totals don't match my cloud bill. How do I debug?
Checklist:
Check for excluded charges: Credits, refunds, or taxes may not be allocated
Rounding errors: Proportional allocation can create $0.01-$1.00 deltas, acceptable if small
Date range mismatch: Ensure your billing period aligns with allocation run dates
Double-counting: Make sure no resource is caught by multiple overlapping rules
Missing rules: Export unallocated costs and create rules for top categories
Sample reconciliation query:
SELECT |
How do I handle one-time charges or credits?
Recommended approach: Exclude them from allocation entirely. One-time items (AWS promotional credits, refunds, annual license prepayments) distort team costs if allocated. Instead:
Create an exclusion rule (see Rule Library, Rule 6)
Track these separately as "Non-operational charges"
Report them to finance but don't burden operational teams with them
If you must allocate (e.g., finance policy requires it), use a fixed split proportional to overall team spend. But document this clearly, teams will question it.
12. Next Steps: Your Action Plan
If you're just starting:
Run a 1-hour discovery session with finance and cloud engineering to baseline current allocation coverage
Implement 3 quick wins:
Export billing data and calculate what % is tagged
Pick your top unallocated cost category and design one allocation rule
Present a showback report for a single team to get feedback
Set a 90-day goal: Increase allocation coverage from X% to 90%+
If you're stuck in manual spreadsheets:
Quantify the pain: How many hours/month are you spending on allocation?
Evaluate cloud-native tools first (AWS Cost Explorer, Azure Cost Management)
If manual effort >10 hours/month, budget for a third-party platform and use the decision matrix in Section 7
If you're ready to scale:
Conduct a quarterly allocation audit using the governance framework in Section 10
Automate tag compliance with policy-as-code
Move from showback to chargeback (if stakeholders are ready)
Build a cost culture: Embed allocated cost dashboards in team workflows, celebrate optimization wins, and make cost visibility a default part of engineering reviews
Want Help Implementing This?
If you're managing a large amount of cloud spend and want expert guidance on building your allocation framework, schedule a 30-minute consultation with our FinOps team. We'll review your environment, identify quick wins, and design a custom roadmap.
No sales pitch, just practical advice from practitioners who've built allocation systems at scale.
Final Thought: Allocation is a Journey, Not a Destination
Here's the truth: you'll never achieve perfect allocation. Cloud environments are too dynamic, tagging discipline erodes, and business priorities shift. That's okay.
The goal isn't perfection, it's continuous improvement and defensible decision-making. Start with 70% allocation coverage. Get to 90%. Refine your rules quarterly. Invest in governance. Celebrate wins when teams optimize costs because they can finally see them.
Allocation is the foundation that makes everything else in FinOps possible, forecasting, optimization, unit economics, showback, and cultural transformation. Do it well, and you'll turn cloud costs from a black box into a strategic lever.
Now go forth and allocate.
About the Author: This guide was written by the FinOps team atOpsolute, who work closely with engineering and finance teams to bring clarity and accountability to cloud costs. The insights, examples, and rules shared here come directly from real projects and day-to-day problem-solving, not theory, and definitely not vendor decks.
Questions? Reach out to our team at Opsolute or connect on LinkedIn, always happy to talk allocation over coffee (virtual or otherwise).
Stop guessing what your AWS bill will be next quarter.
Connect your AWS Organization in under 30 minutes. Most customers see their first chargeback report in 14 days and realize a 5–10× return on Opsolute within 90 days.
