Published by
Vishnu Siddarth
on

Introduction
Who This Guide Is For: FinOps practitioners tracking cloud spend, Product Managers pricing new tiers, Finance teams forecasting infrastructure costs, and Cloud Architects designing cost-efficient systems.
Most cloud teams are flying blind. They see the monthly AWS bill climb from $50K to $200K, but they can't answer the question that actually matters: What does each customer cost us to serve?
That gap between gross cloud spend and unit-level visibility is where profitability disappears. You're optimizing in the dark, rightsizing instances without knowing if you're improving margins, purchasing reserved instances without understanding customer-level ROI, and explaining cost growth to finance with nothing but aggregate numbers.
This guide walks through the complete methodology for measuring cloud costs at the unit level, from choosing your metric to automating ongoing tracking. You'll get a repeatable framework, worked examples, and ready-to-use templates that connect every dollar of cloud spend to the customers, transactions, or API calls that drive your business.
Key Highlights
Most cloud teams track total spend but lack visibility into cost per customer, where profitability is actually determined
Unit economics ties every dollar of cloud spend to revenue-driving units like customers, transactions, or API calls
Accurate unit cost measurement requires tagging, resource mapping, and fair allocation of shared infrastructure
Segment-level unit economics reveals hidden loss-makers, often showing premium or enterprise tiers operating at negative gross cloud margin
Proper tagging and allocation can uncover 20 to 40 percent optimization opportunities and enable confident pricing decisions
Sensitivity analysis ensures methodology stability and prevents executive teams from acting on misleading cost signals
A structured 30/60/90-day rollout converts chaos into predictable, automated unit cost tracking
Automated unit economics transforms FinOps from reactive cost-cutting into strategic architectural and pricing decisions
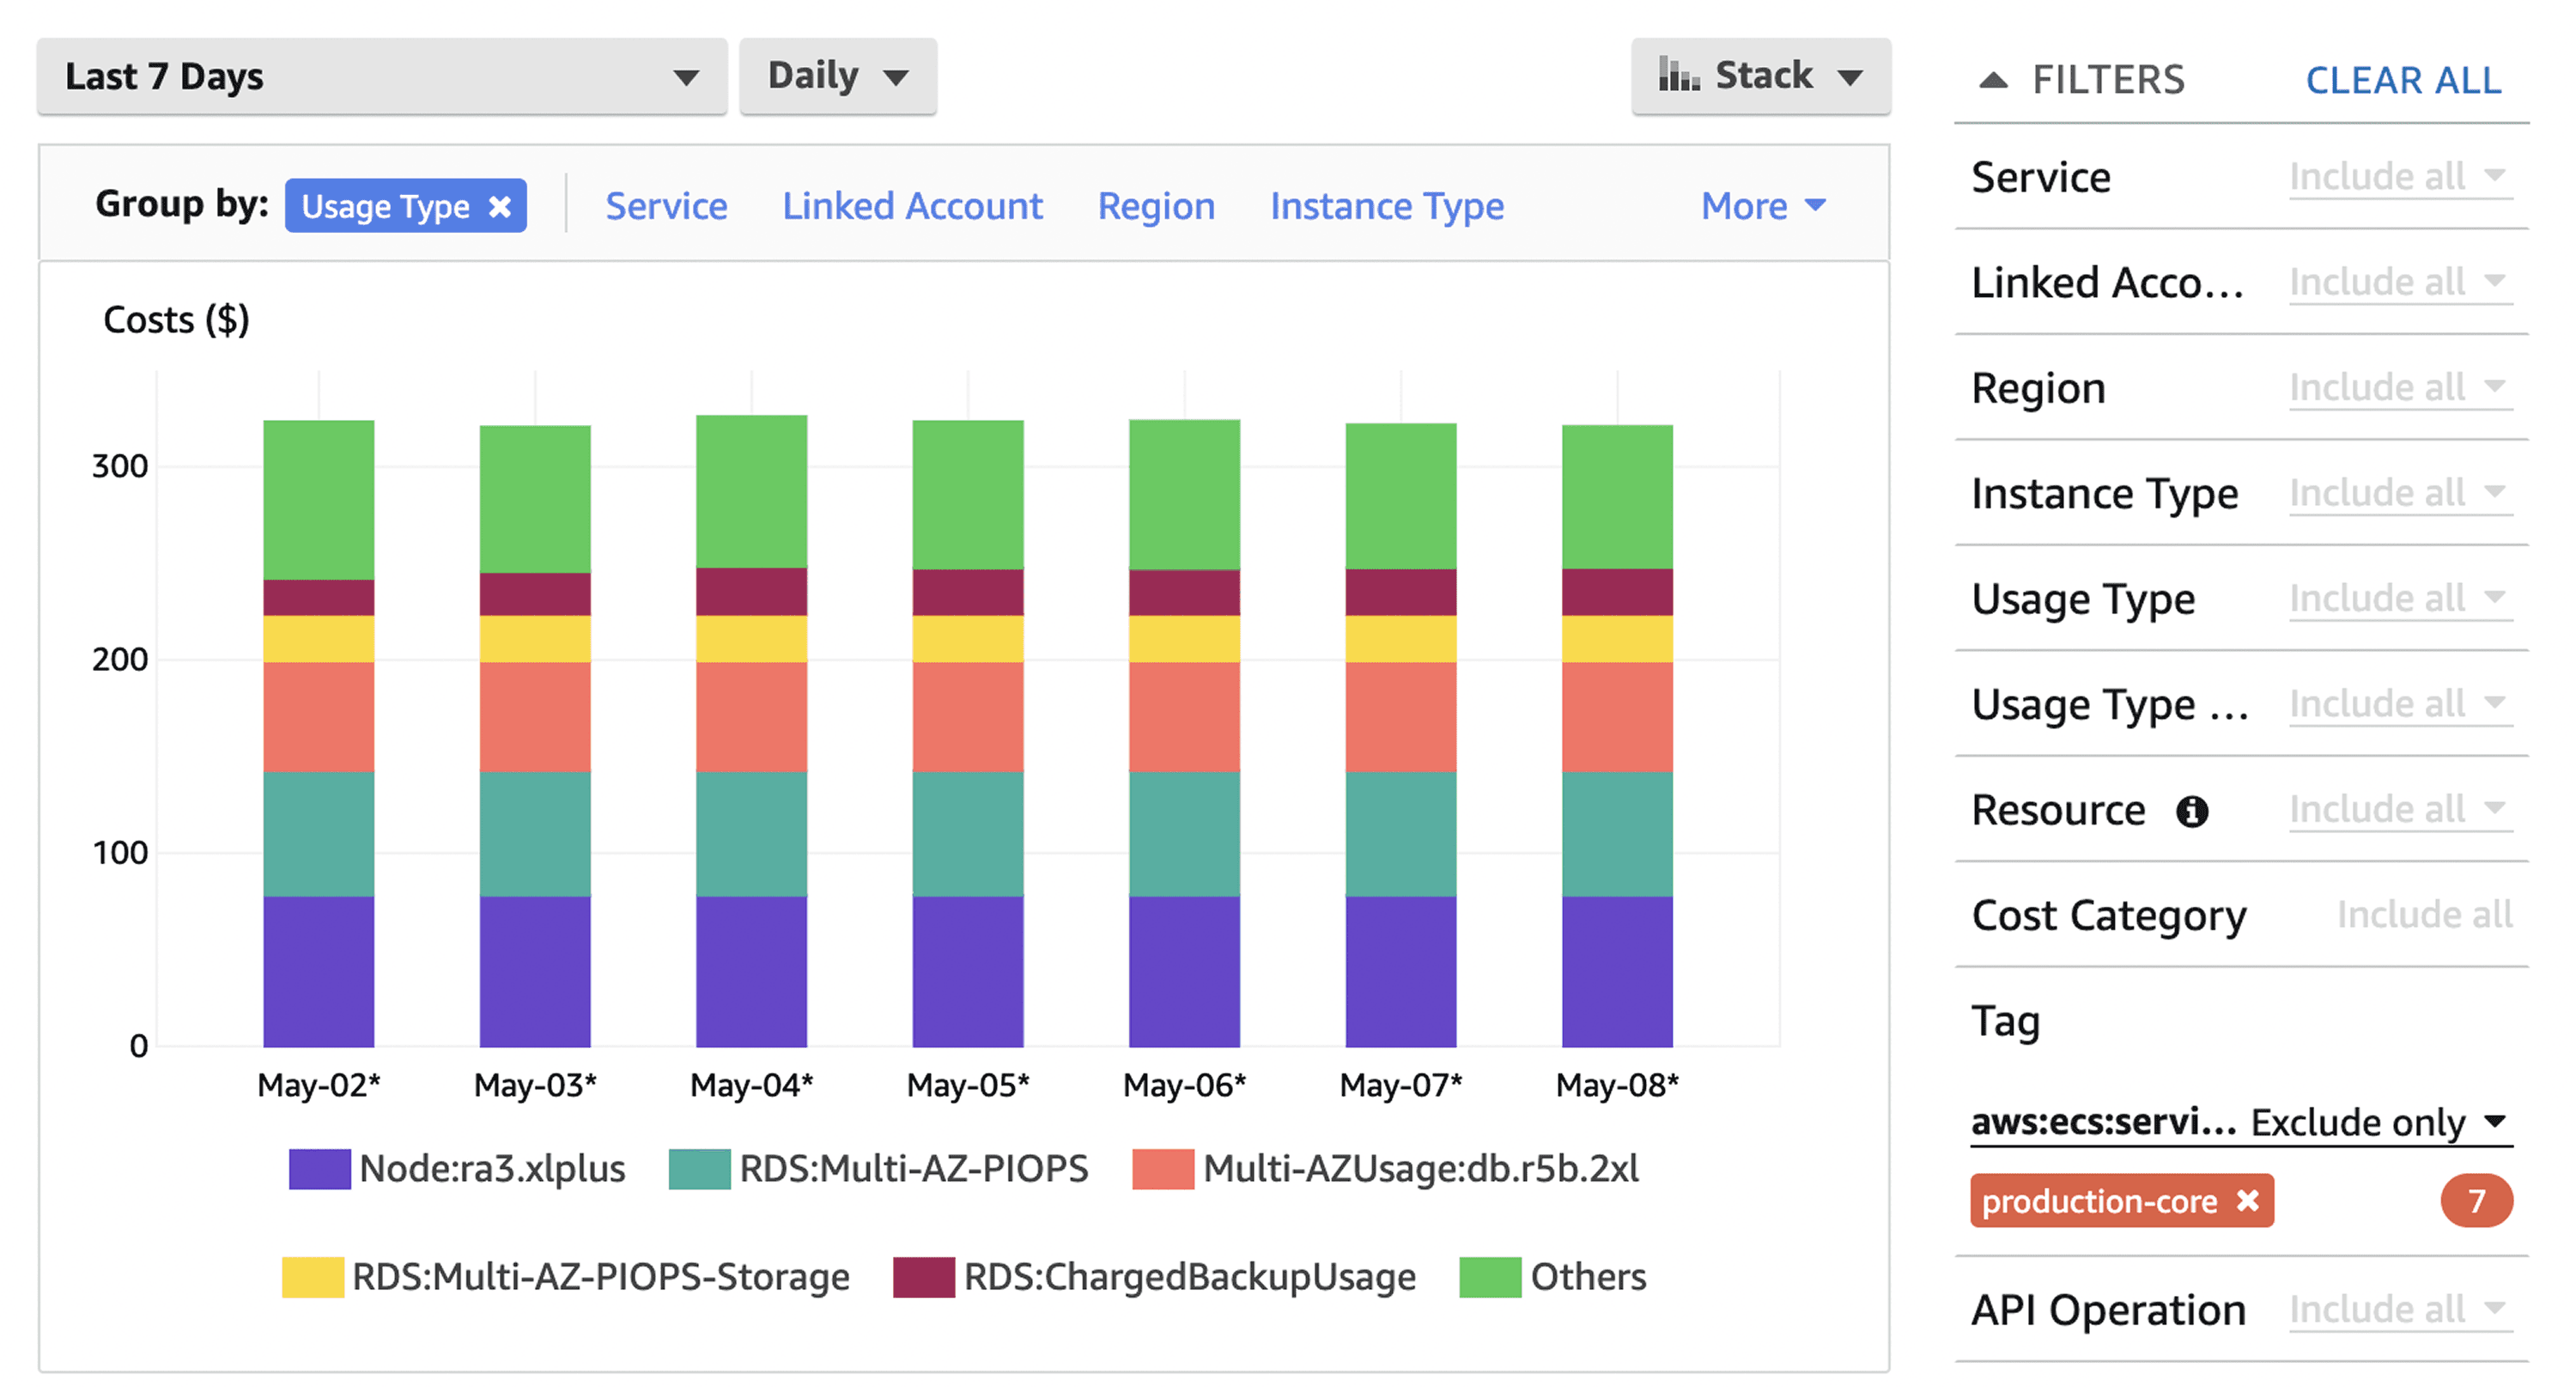
To see where S3 spend is really going, start by implementing clear cost allocation methods that map storage usage back to teams, products, or workloads.
Why Unit Economics Transforms Cloud Financial Management
Understanding your cloud bill at the unit level fundamentally changes how you operate. Instead of seeing a $180,000 monthly AWS charge, you see that Customer Segment A costs $2.30 per active user while Segment B costs $8.75, revealing that your premium tier is actually underwater on cloud costs alone.
Unit economics doesn't just enable smarter cost optimization, it unlocks confident pricing decisions. You can't price a new tier without knowing what it costs to deliver.
This visibility enables three critical capabilities most teams lack:
Pricing decisions backed by real cost data. When you know that serving each customer costs $3.50 in cloud infrastructure, you can price confidently instead of guessing. One SaaS company discovered their "growth" tier cost $7.20 per user to serve while charging $8/month, leaving virtually no margin for sales, support, or development. They repriced the tier and improved gross margins by 18 points.
Optimization efforts prioritized by business impact. Rightsizing that RDS instance saves $800/month, but without unit-level visibility, you can't quantify the business value. Unit economics lets you say "this optimization reduces cost per enterprise customer by $0.45, improving segment margin by 6%." That's a conversation executives understand.
Breaking S3 costs down into per-user or per-transaction cloud unit economics costs also helps you understand the real economics of storing and serving data.
Capacity planning aligned with revenue growth. When customer acquisition accelerates, can your infrastructure scale profitably? Without unit costs, you're reactive, discovering margin compression only after it happens. With unit costs, you can model the economics of 10,000 new customers before signing the contract.
Core Definitions: Building Your Foundation
Let's establish precise definitions. Ambiguity here creates measurement inconsistencies that compound over time.
Unit Economics is cost visibility paired with business context. It answers "what does each revenue-generating unit cost us?" by connecting cloud infrastructure spend to the customers, transactions, or activities that drive your business value. Without this pairing, you have accounting data but no business intelligence.
Unit of Measure is the fundamental business metric you'll track costs against. Common examples include active monthly users (for SaaS), transactions processed (for payment platforms), API calls served (for developer platforms), or deliveries completed (for logistics).
Historical S3 usage trends can further improve your cloud cost forecasts, making future storage budgets far more predictable.
Your unit should be tied to revenue or correlated with customer value. Don't choose "compute hours" as your unit, that's a resource metric, not a business metric. Choose "paying customers" or "premium subscribers" instead.
Direct Costs are cloud expenses directly attributable to specific units without allocation assumptions. If you tag an EC2 instance customer:acme-corp, that instance cost is direct. If Customer Acme's application tier runs on dedicated infrastructure, those costs are direct.
Shared Costs are cloud expenses that serve multiple units simultaneously. These require allocation logic: multi-tenant databases serving all customers, shared caching layers, central logging infrastructure, network transit and load balancers, monitoring and security tools.
Allocation Driver is the metric used to distribute shared costs proportionally. Common drivers include CPU-hours consumed per customer, storage capacity used per customer, API call volume per customer, or revenue contribution per customer.
Effective Unit Margin is revenue per unit minus cost per unit. This is your true north metric, the number that tells you if serving each customer is fundamentally profitable before accounting for sales, marketing, or overhead.
The Six-Step Methodology for Calculating Unit Costs
This framework works whether you're a 10-person startup or a 10,000-person enterprise. The complexity scales, but the logic remains constant.
Before You Begin: Readiness Checklist
Assess your starting position before diving into the methodology:
Tagging coverage: What percentage of your cloud spend has meaningful tags? (Target: Start if you have 30%+, anything below requires tagging foundation work first)
Billing data access: Can you export 90 days of itemized billing data to CSV or data warehouse? (Required for allocation analysis)
Unit metric clarity: Can you define your primary business unit in one sentence? (If not, workshop this with product/finance before proceeding)
Architectural documentation: Do you know which resources serve which customers? (Even rough mapping is sufficient to start)
Simple actions like deleting stale objects, enabling lifecycle policies, or moving data to cheaper tiers often unlock immediate aws savings.
If you answered "no" to billing data access, stop here and establish data export pipelines first. Everything else can be built iteratively.
Step 1: Choose Your Primary Unit
Start by identifying what you're measuring. This decision shapes everything downstream, so invest time here.
For B2B SaaS, "paying organization" or "monthly active user" work well. For transactional platforms, "successful transaction" captures value better than "user account." For API businesses, "billable API call" aligns with revenue.
The test: Can you easily explain to your CFO how changes in this metric affect both revenue and cost? If yes, you've chosen correctly.
Step 2: Map Resources to Units
Create a resource-to-unit mapping that shows which cloud services support which customers or transactions. This requires understanding your architecture: which databases serve which customer segments, whether compute instances are dedicated or shared, and which services are purely operational versus customer-facing.
Document this in a simple table:
Resource Type | Usage Pattern | Tagging Status | Attribution Method | Example |
Production RDS cluster | Shared | Untagged or cluster-level only | Allocate proportionally by CPU-hours or connection count | Multi-tenant PostgreSQL instance serving 50 customers; allocate costs based on each customer's query execution time |
Customer storage buckets | Direct | Tagged by customer ID or project | Direct attribution via cost allocation tags | Bucket |
Redis cache cluster | Shared | Service-level tagging | Allocate by API request volume or cache hit ratio | Shared Redis cluster; track cache keys by customer prefix, allocate based on eviction rates or memory consumption |
Lambda functions | Mixed | Function-level + invocation tags | Service-level allocation, then drill down by invocation metadata | Auth functions (shared overhead) + customer-specific data processing functions (direct); use execution logs to attribute invocations |
Step 3: Implement Comprehensive Tagging
Tagging is the foundation of accurate unit economics. Without it, you're guessing at allocations.
Establish a tagging taxonomy that includes Environment (production, staging, development), Service (api, database, storage, compute, network), CustomerID (unique customer identifier), and Team (engineering team owner).
Apply tags at resource creation through Infrastructure as Code rather than manual tagging. Manual processes drift within weeks.
AWS example using Terraform:
resource "aws_instance" "app_server" { |
Enforce tagging through cloud governance policies. AWS Tag Policies and Azure Policy can block resource creation without required tags.
Step 4: Allocate Shared Costs Using Fair Drivers
For each shared resource, choose an allocation driver that reflects actual consumption.
Good Driver vs. Bad Driver Example:
Bad driver: Allocating database costs equally across all customers (Customer A with 100 queries/day pays the same as Customer B with 50,000 queries/day).
Good driver: Allocating database costs by query volume logged per customer (Customer A pays for their 100 queries, Customer B pays proportionally for their 50,000 queries).
The difference: Fair drivers reflect actual consumption patterns. Bad drivers create cross-subsidies where light users overpay and heavy users get a discount they don't deserve.
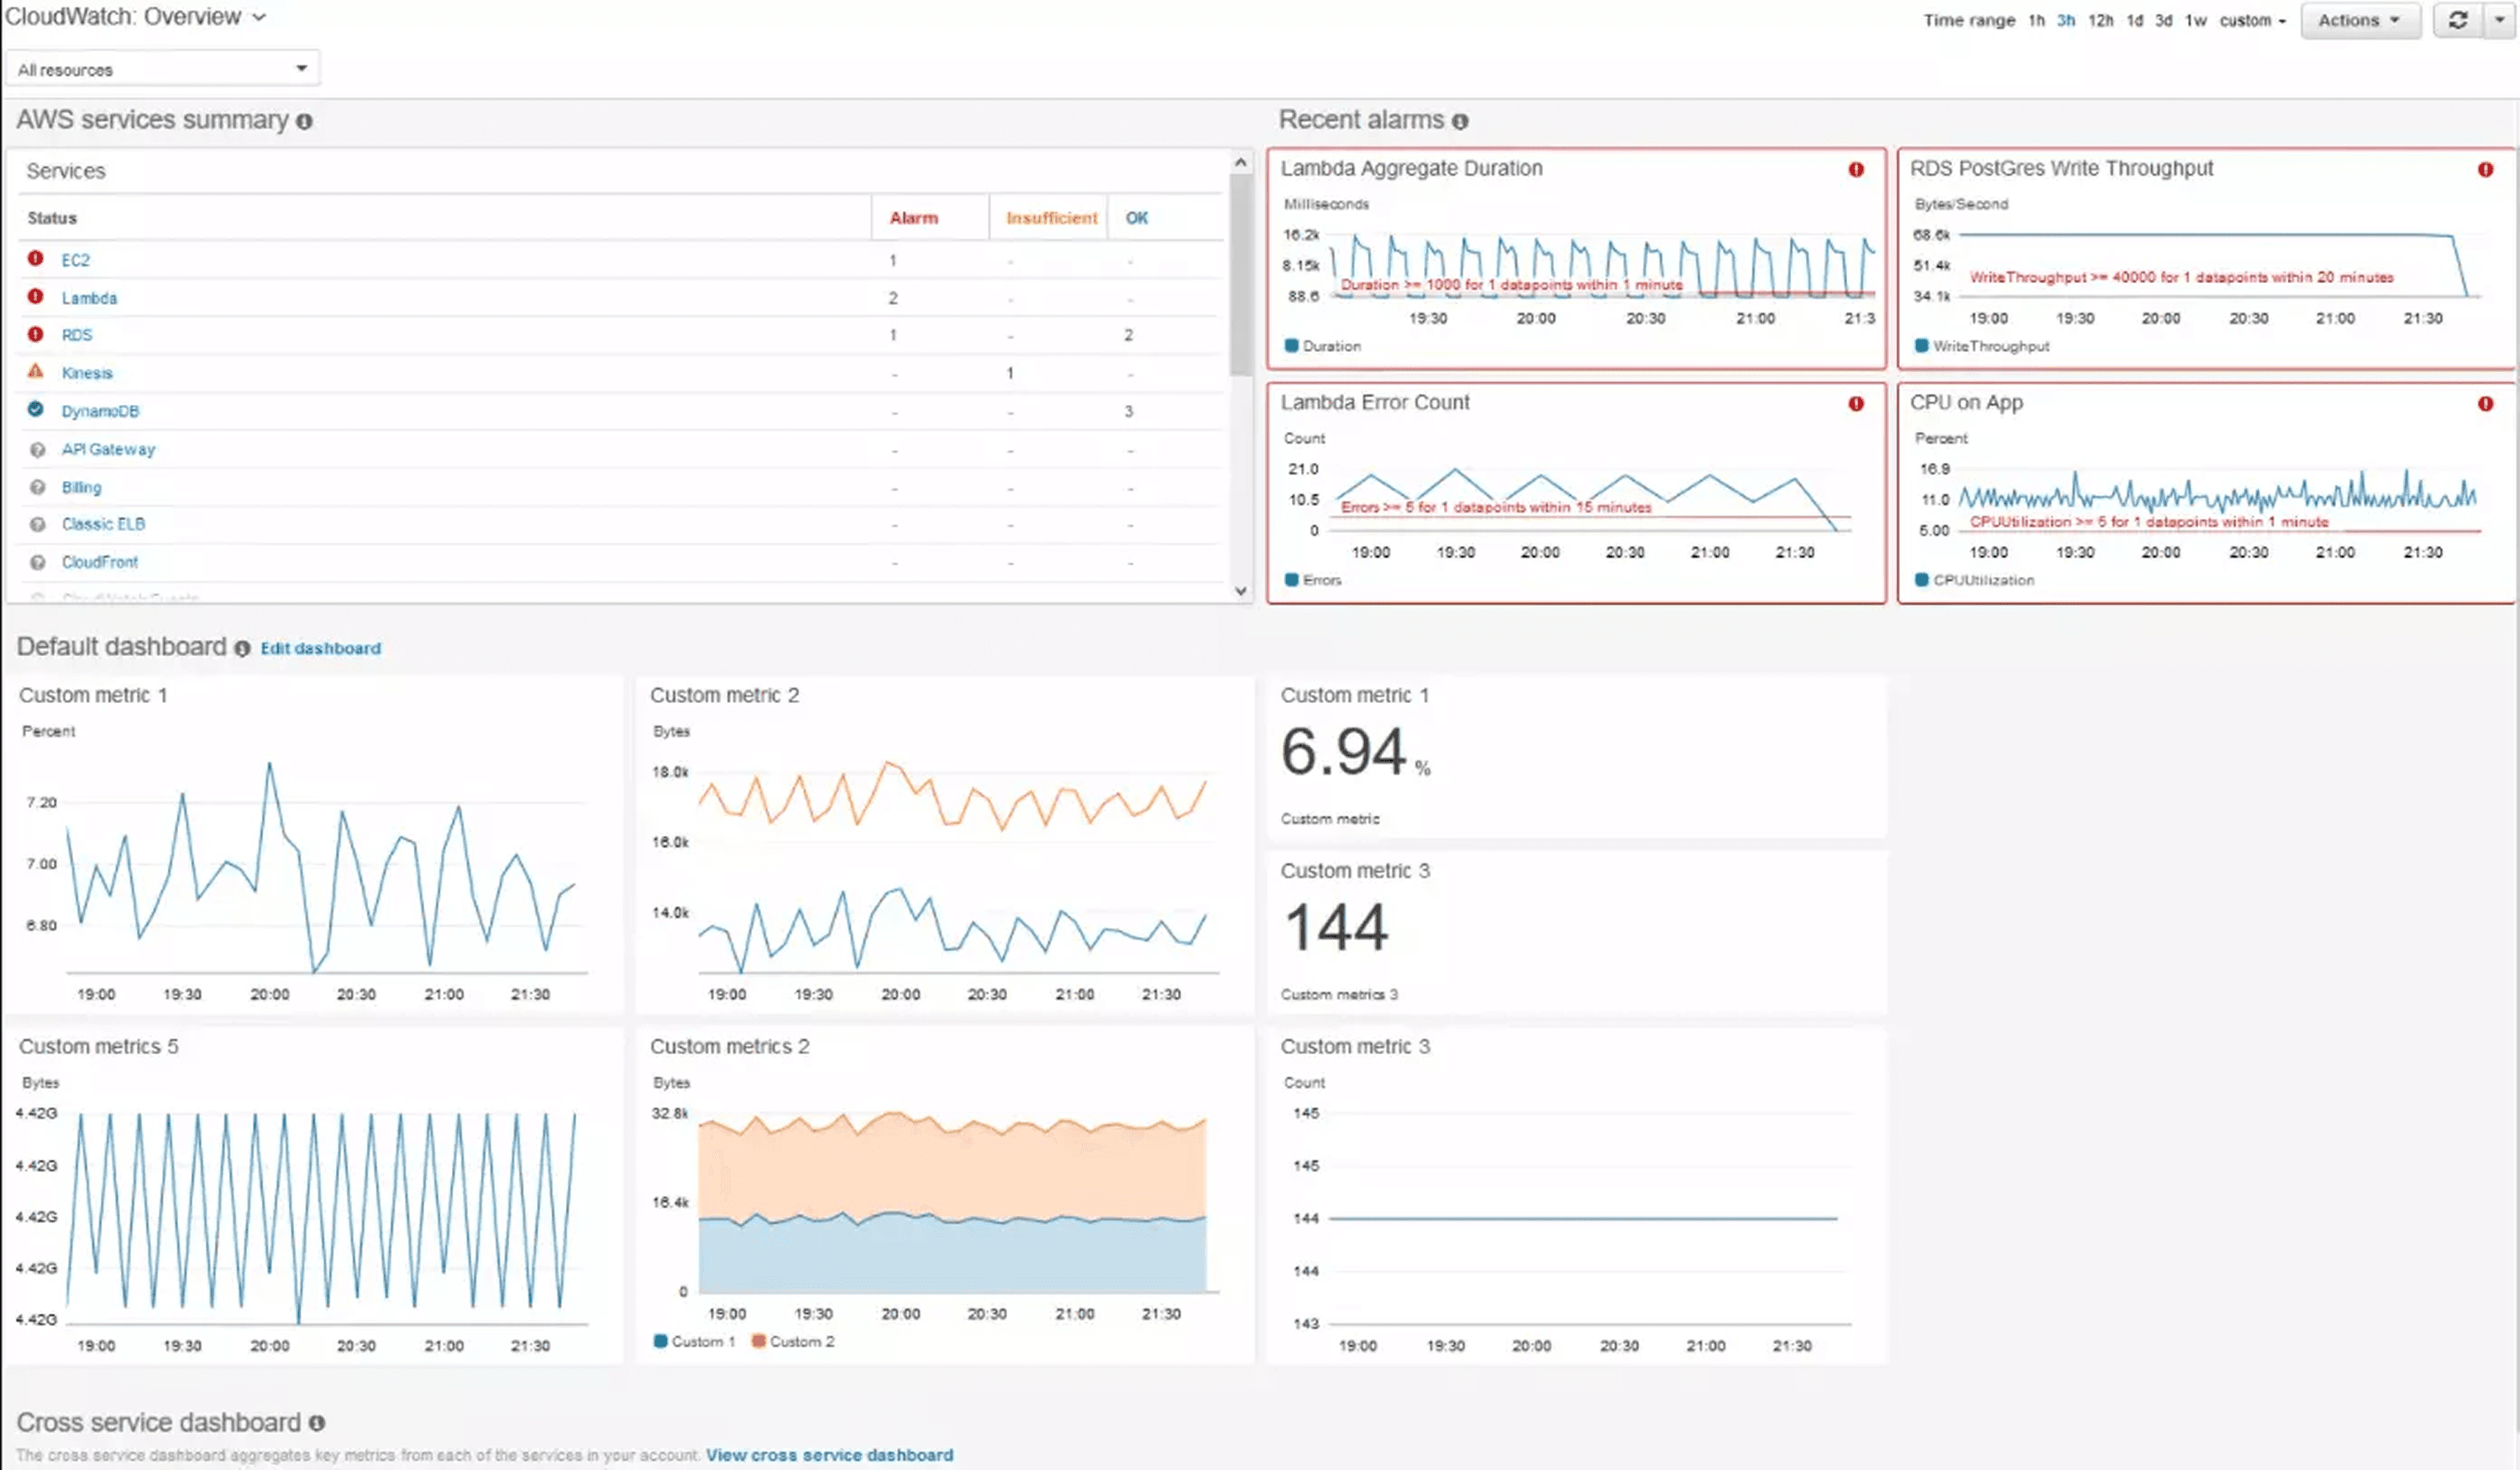
Database costs: Allocate by query count, connection time, or storage used per customer. Export CloudWatch metrics to determine per-customer database usage.
Compute costs: For shared application servers, allocate by CPU time consumed serving each customer's requests. This requires application-level instrumentation that logs customer ID with request duration.
Storage costs: Direct allocation when using customer-specific buckets or tables. For shared storage, allocate by actual bytes stored per customer.
Network costs: Allocate data transfer by customer API volume or payload size. Heavy API users should bear proportionally higher network costs.
Document your allocation decisions. When someone questions why a customer's unit cost jumped, you need to explain which driver changed and why the allocation is fair.
Step 5: Calculate Cost Per Unit
Now combine direct costs and allocated shared costs to compute your unit metric.
Basic calculation example:
Month: October 2025 |
Segment-level calculation reveals where your economics actually work:
Customer Segment | Direct Costs | Allocated Shared | Total Cost | Customer Count | Cost Per Customer | Revenue Per Customer(subscription plan) | Margin |
Enterprise | $42,000 | $18,000 | $60,000 | 120 | $500 | $1,200 | $700 |
Mid-Market | $21,000 | $15,000 | $36,000 | 480 | $75 | $180 | $105 |
SMB | $12,000 | $12,000 | $24,000 | 1,800 | $13.33 | $25 | $11.67 |
This breakdown tells you that Enterprise customers are highly profitable from a unit economics perspective, while SMB customers have thin margins that might not survive once you add sales and support costs.
Step 6: Validate with Sensitivity Analysis
Unit cost calculations include assumptions. Test how sensitive your results are to assumption changes.
Run scenarios: What if database allocation shifted from query count to storage used? What if we allocated network costs differently? What if we tagged 20% more resources as direct instead of shared?
If your unit cost swings wildly based on reasonable assumption changes, your methodology isn't robust. Refine your allocation drivers until results are stable.
Worked Example: SaaS Platform Cost-Per-Customer Calculation
Let's walk through a complete real-world scenario using a B2B SaaS platform serving 1,500 paying customers.
Scenario: CloudMetrics is a monitoring SaaS with three tiers: Starter ($49/mo), Professional ($149/mo), and Enterprise ($499/mo). October cloud spend totaled $95,000.
Resource Inventory:
Direct costs (tagged by customer):
S3 storage buckets: $15,000
Customer-specific Lambda executions: $8,000
Dedicated enterprise RDS instances: $12,000
Shared costs (requires allocation):
Multi-tenant PostgreSQL cluster: $28,000
Application server fleet: $18,000
Redis caching layer: $6,000
Load balancers and network: $5,000
Monitoring tools: $3,000
Allocation Drivers:
PostgreSQL: Allocate by query volume Application servers: Allocate by CPU time Redis: Allocate by API call count Network: Allocate by data transfer volume
Customer Metrics:
Customer Tier | Count | Total Queries | CPU Hours | API Calls | Data Transfer (GB) |
Starter | 1,200 | 2,400,000 | 180 | 18,000,000 | 1,200 |
Professional | 250 | 1,500,000 | 220 | 12,000,000 | 1,800 |
Enterprise | 50 | 1,100,000 | 400 | 10,000,000 | 2,000 |
Calculated Allocations:
PostgreSQL by query volume:
Starter: (2.4M / 5M) × $28,000 = $13,440
Professional: (1.5M / 5M) × $28,000 = $8,400
Enterprise: (1.1M / 5M) × $28,000 = $6,160
Application servers by CPU hours:
Starter: (180 / 800) × $18,000 = $4,050
Professional: (220 / 800) × $18,000 = $4,950
Enterprise: (400 / 800) × $18,000 = $9,000
Final Unit Cost Calculation:
Cost Category | Starter | Professional | Enterprise |
Total allocated shared | $21,390 | $17,450 | $18,660 |
Total direct costs | $9,200 | $8,300 | $17,500 |
Total tier cost | $30,590 | $25,750 | $36,160 |
Customer count | 1,200 | 250 | 50 |
Cost per customer | $25.49 | $103.00 | $723.20 |
Revenue per customer | $49.00 | $149.00 | $499.00 |
Gross cloud margin | $23.51 | $46.00 | -$224.20 |
Key Insights:
Enterprise tier is underwater on cloud costs alone, charging $499/month while spending $723 per customer. This explains why finance has been concerned about profitability despite revenue growth.
Professional tier shows healthy margins at $46 gross profit per customer after cloud costs.
Starter tier is profitable on cloud economics but has the thinnest margin, any optimization here directly impacts bottom line.
Mapping Unit Costs to Optimization Tactics
Understanding unit costs reveals which optimizations actually improve business outcomes.
Rightsizing instances reduces allocated compute costs. If application servers represent $18,000 in monthly spend and rightsizing saves 25%, that's $4,500, but more importantly, it's $3.00 per customer in cost reduction, improving margin by 6%.
Reserved Instances and Savings Plans impact predictable workloads. Purchasing a 1-year Compute Savings Plan could reduce EC2 costs by 40% ($7,200/month), lowering cost per customer by $4.80 across all tiers.
Storage tiering creates asymmetric savings. Moving infrequently accessed data to S3 Glacier Deep Archive saves 95% on storage costs. For Starter customers with average 8GB storage, migrating 60% to Glacier reduces per-customer storage cost from $5.00 to $1.40, a $3.60 improvement.
Database query optimization has outsized impact because database costs are typically allocated widely. Reducing query volume by 20% through caching and query consolidation can save thousands monthly across all customers.
Pro Tip: Prioritize optimizations by "cost per unit impact per hour invested." Some tactics take months to implement but only save $0.10 per customer. Others take a day and save $2.00 per customer.
Provider-Specific Considerations
Cloud provider pricing varies significantly in ways that affect unit economics.
AWS excels at compute flexibility with extensive instance families and Spot pricing. As of late 2025, AWS offers 100 GB of free data transfer out per month (increased from 1 GB), but beyond that, egress costs start at $0.09/GB for the first 10TB. AWS also now waives egress fees for customers migrating data off AWS to other providers or on-premises.
GCP often shows better price-performance for sustained workloads due to sustained-use discounts (automatic savings without reservations). Network egress pricing is competitive with AWS.
Azure Hybrid Benefit (reusing Windows/SQL licenses) creates dramatic savings if you're migrating from on-prem. Cost per unit can be 40% lower than AWS for Windows workloads simply by leveraging existing licenses.
ARM-based instances (AWS Graviton, Azure Ampere) offer 20% better price-performance for stateless workloads. Migrating application servers to Graviton can reduce per-unit compute allocation by 20% with identical performance.
Storage class selection dramatically affects unit costs. As of November 2025, S3 Standard costs $0.023/GB/month for the first 50TB, while S3 Standard-Infrequent Access is $0.0125/GB/month (46% savings), and S3 Glacier Instant Retrieval is $0.004/GB/month (83% savings).
Implementation Checklist: 30/60/90-Day Rollout
Days 1-30: Foundation
Audit existing tagging coverage (target: 70% of resources tagged)
Define tagging taxonomy (Environment, Service, CustomerID minimum)
Implement tagging in IaC templates
Export 3 months of cloud billing data to data warehouse
Choose primary unit of measure
Document allocation methodology for shared resources
Create cost per unit baseline spreadsheet
Days 31-60: Measurement
Implement allocation driver tracking (query logs, CPU time, API volume)
Build automated unit cost calculation pipeline
Create dashboard showing cost per unit by customer segment
Validate allocated costs sum to actual spend (should be 100% ± 2%)
Perform sensitivity analysis on allocation assumptions
Calculate effective margin (revenue per unit - cost per unit)
Identify top 3 optimization opportunities based on unit impact
Days 61-90: Optimization
Implement top optimization (based on unit cost impact)
Set up automated anomaly alerts for unit cost changes (>15% variance)
Enforce tagging via cloud governance policies
Establish monthly unit cost review meeting
Create goal metrics (target cost per unit by segment)
Share unit cost context with product for pricing decisions
Track these success KPIs: Tagging coverage (target 90%+ of spend), calculation confidence (allocated costs within 5% of actual spend), and actionability (at least 2 optimization decisions made using unit cost data).
Automating Unit Economics Measurement
Manual spreadsheet tracking works for initial baselines, but sustainable unit economics requires automation. Modern FinOps platforms can accelerate your implementation by providing built-in capabilities for resource tagging, cost allocation hierarchies, and automated anomaly detection when unit costs deviate from expected patterns.
Look for solutions that support multi-cloud visibility (AWS, Azure, GCP), granular tag-based cost attribution, and forecasting capabilities that project unit costs alongside total spend. The right tooling transforms unit economics from a monthly analysis exercise into a continuous optimization feedback loop.
Common Questions and Troubleshooting
What if I have a multi-tenant architecture where attributing costs directly is impossible?
Start with cohort-level measurement instead of individual customer attribution. Group customers by size (SMB, mid-market, enterprise) or usage pattern (light, medium, heavy). Measure average cost per cohort using allocation drivers.
How do I allocate costs for resources that support both paying customers and free users?
Decision point: Are free users a customer acquisition cost or a product feature? If acquisition cost, allocate free-tier usage to sales/marketing budget, not unit cost. If product feature, create separate unit metric "cost per active user (all tiers)" alongside "cost per paying customer."
My unit costs fluctuate wildly month-to-month. How do I stabilize them?
Volatility usually stems from inconsistent unit counts, lumpy direct costs (orphaned resources from churned customers), or allocation assumption changes. Calculate 3-month rolling averages to smooth out noise while retaining trend visibility.
Should I allocate the cost of development/staging environments to unit costs?
No. Development and staging are organizational capability costs, not customer-serving infrastructure. Track them separately as "engineering productivity costs."
My allocated costs don't sum to actual spend. What's wrong?
Common culprits include untagged resources, tax and support fees (allocate separately), credits and discounts (back these out before calculating), and data transfer costs often tagged at account level.
Key Formulas and Quick Reference
Here's everything you need to start measuring cloud unit economics today:
Essential Formulas:
Cost Per Unit (Basic):
Cost Per Unit = Total Cloud Costs / Number of Units |
Cost Per Unit (Allocated):
Cost Per Unit = (Direct Costs + Allocated Shared Costs) / Number of Units |
Allocated Shared Cost:
Allocated Shared Cost = (Unit's Driver Value / Total Driver Value) × Total Shared Cost |
Effective Unit Margin:
Effective Unit Margin = Revenue Per Unit - Cost Per Unit |
Implementation Path:
Choose your unit (paying customers, transactions, API calls)
Tag resources (Environment, Service, CustomerID minimum)
Map direct costs (dedicated resources to specific customers)
Allocate shared costs (use drivers like CPU-hours, query count, API volume)
Calculate and validate (ensure allocated costs sum to actual spend)
Optimize strategically (prioritize by cost per unit impact)
Key Success Metrics:
90%+ tagging coverage of total spend
Allocated costs within 5% of actual cloud bill
At least 2 optimization decisions informed by unit cost data within 90 days
Your Next Steps: From Calculation to Action
You now have the complete methodology for calculating cloud unit economics. Here's how to transform this knowledge into sustained competitive advantage.
This week: Export your last 3 months of cloud billing data. Create a simple spreadsheet with your current customer count and total monthly spend. Calculate basic cost per customer as a starting baseline, even without allocation logic, this number tells you something.
This month: Implement tagging for your top 10 resources by cost. These typically represent 70-80% of total spend. Once tagged, calculate allocated cost per customer using the formulas above. Share findings with one stakeholder to begin building organizational alignment.
This quarter: Build the automated pipeline that calculates unit costs monthly without manual intervention. Set threshold alerts that notify you when cost per customer changes by more than 15% month-over-month. Use these insights to prioritize at least one optimization project.
Unit economics transforms cloud cost management from reactive fire-fighting into strategic planning. Teams that measure cost per customer make better architectural decisions, price their products confidently, and scale profitably.
The difference between "we spent $200K on cloud this month" and "we spent $45 per customer, down from $52 last quarter" is the difference between visibility and understanding. Start measuring today.
Ready to master cloud unit economics? Visit Opsolute to discover how intelligent cost allocation, automated anomaly detection, and hierarchical chargeback capabilities can transform your cloud unit economics from spreadsheet guesswork into real-time business intelligence.
Stop guessing what your AWS bill will be next quarter.
Connect your AWS Organization in under 30 minutes. Most customers see their first chargeback report in 14 days and realize a 5–10× return on Opsolute within 90 days.
