Published by
Opsolute Team
on

Introduction
Every month, finance sends the cloud bill. Every month, engineering leaders cringe. Last quarter alone, your cloud costs jumped 30% while actual usage grew just 15%. The math doesn't add up, but the charges are real.
Here's the reality: enterprises waste between 30-35% of cloud spending on resources that sit idle, instances provisioned for peaks that never materialize, and environments forgotten after projects end. With global cloud expenditure surpassing $720 billion in 2025, even modest optimization efforts unlock millions in savings. Organizations implementing systematic cost strategies consistently achieve 20-30% reductions without sacrificing performance or reliability. This explores what is cloud cost optimization and it walks through 10 proven, vendor-neutral tactics spanning rightsizing, intelligent automation, commitment strategies, and cultural transformation that turn cloud costs from budget drain into strategic advantage.
Key Highlights
Organizations waste 30-35% of cloud spending on idle resources, oversized instances, and forgotten environments that accumulate charges unnoticed
Rightsizing over-provisioned resources delivers 20-40% savings while Reserved Instances and Savings Plans offer up to 75% discounts on committed usage
Spot instances provide up to 90% cost reduction for fault-tolerant workloads like batch processing, CI/CD pipelines, and containerized applications
Comprehensive tagging, real-time monitoring, and cost allocation models create visibility necessary for effective multi-cloud optimization
Building cost-aware culture with showback models, efficiency KPIs, and regular optimization reviews sustains long-term savings beyond one-time fixes
Strategic storage tiering and lifecycle policies cut storage costs by 70-90% by automatically moving data between hot, cool, and archive tiers
Intelligent autoscaling matches capacity to real-time demand, eliminating the waste of paying for peak capacity 24/7 when traffic varies
Implementation follows a 90-day roadmap: establish visibility (Days 1-30), capture quick wins (Days 31-60), deploy governance (Days 61-90).
Beyond Cost Cutting: What Cloud Optimization Actually Means
Cloud cost optimization isn't about spending less. Cloud cost optimization strategies in this guide about spending smarter.
The distinction matters. Cost cutting often means reducing capacity, which risks performance. Optimization means matching resources to actual needs eliminating waste without compromising reliability. After analyzing 500+ enterprise AWS accounts, the pattern is clear: most overspending comes from resources running 24/7 when needed 8 hours daily, instances sized for peak loads that rarely materialize, and forgotten test environments accumulating charges.
Traditional optimization approaches fail because cloud infrastructure is dynamic. Static monthly reviews can't catch anomalies as they happen. Manual rightsizing can't keep pace with workload changes. Spreadsheet tracking breaks down across multi-cloud environments.
The three core challenges organizations face:
Lack of visibility across environments. When teams deploy across AWS, Azure, and GCP without unified monitoring, finance sees one massive bill while engineers can't identify which services drive costs.
Decentralized decision-making without cost awareness. Developers provision resources based on performance needs, not budget implications. Without real-time cost feedback, small decisions compound into significant waste and reduced using cloud cost optimization tools .
Complex pricing models even experts struggle to navigate. Reserved Instances, Savings Plans, spot pricing, commitment discounts each provider offers different mechanisms with different trade-offs. Making optimal choices requires specialized knowledge most teams lack.
The FinOps Framework: Your Organizational Foundation
FinOps provides the structure for sustainable cost management. It's not just tools it's culture change.
The framework rests on five building blocks working in concert:
Building Block | What It Delivers | Why It Matters |
Accountability | Team ownership of costs | Eliminates "someone else's problem" |
Measurement | Unit economics visibility | Tracks cost per customer, transaction |
Optimization | Continuous improvement | Systematic waste elimination |
Planning | Forecasting and budgeting | Prevents surprise overages |
Tools | Automated governance | Scales human effort |
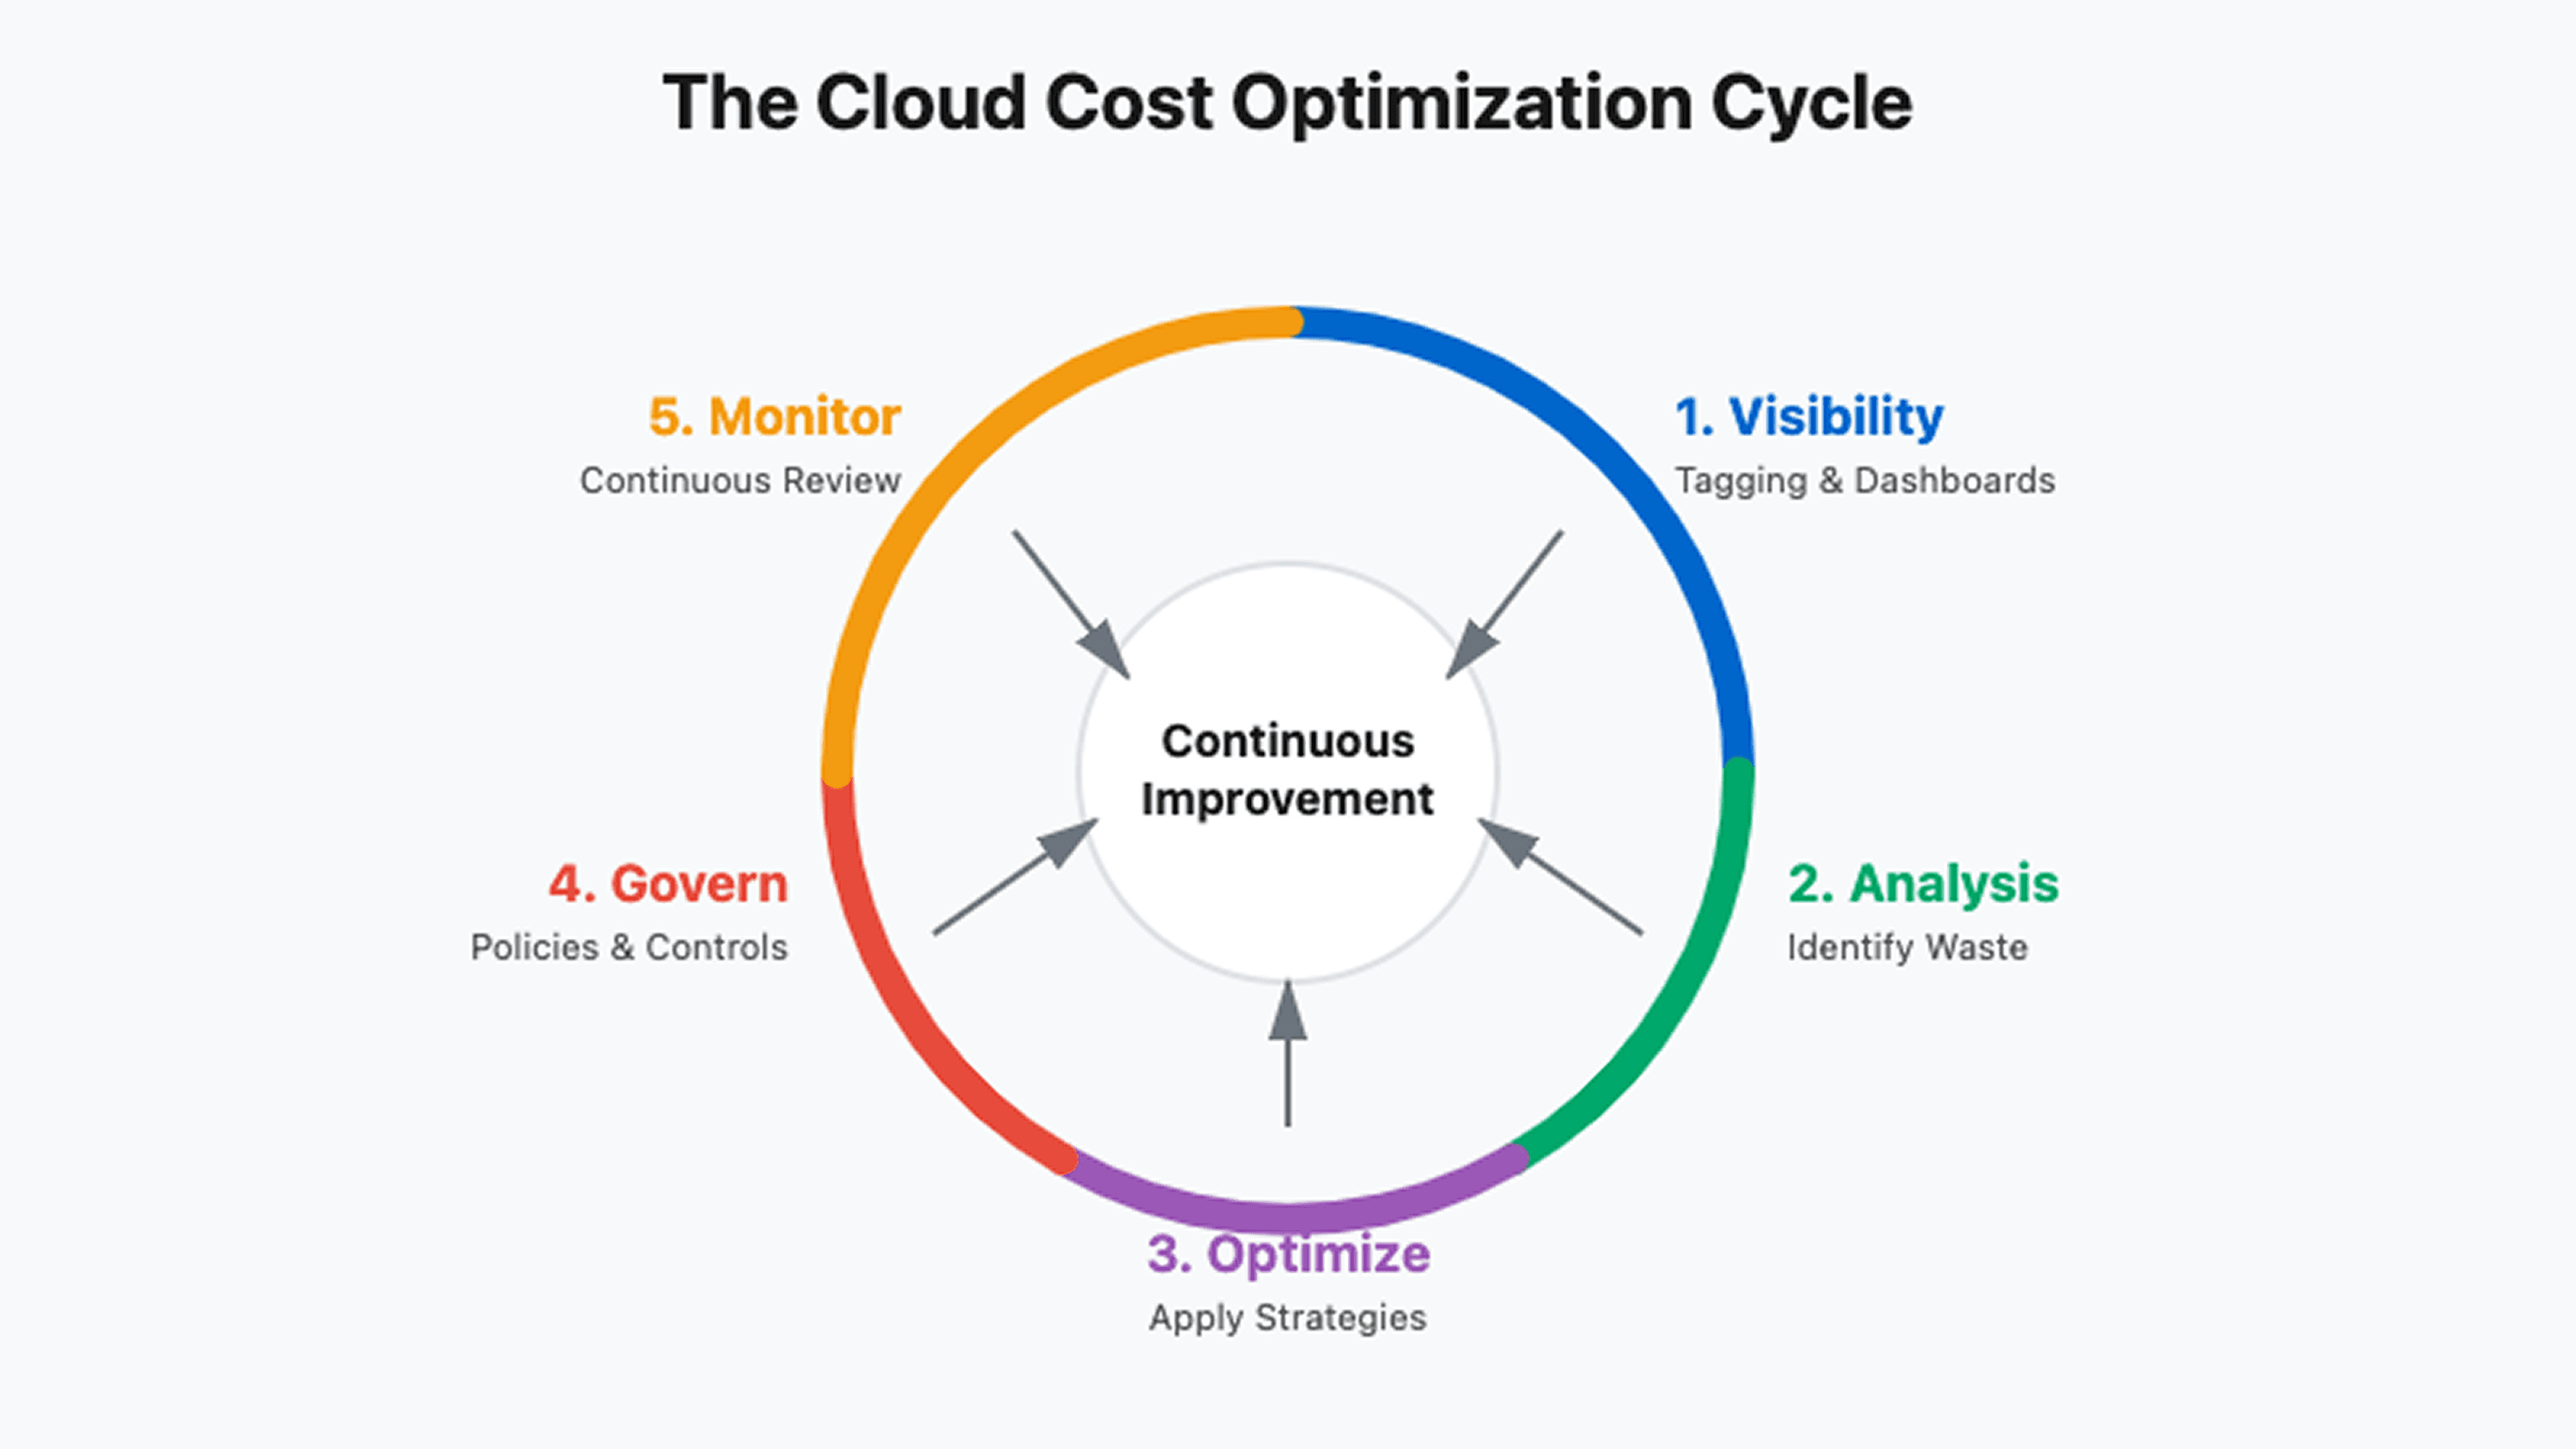
FinOps maturity follows a three-phase journey. Crawl phase establishes basic visibility through tagging and cost dashboards. Teams identify obvious waste but optimization remains manual. Walk phase implements automated policies, commitment purchasing strategies, and chargeback models. Run phase achieves continuous optimization through ML-driven recommendations, predictive forecasting, and embedded cost awareness in engineering workflows.
Most organizations start at Crawl, attempting Run-phase tactics. This fails. Build visibility first. You can't optimize what you can't see.
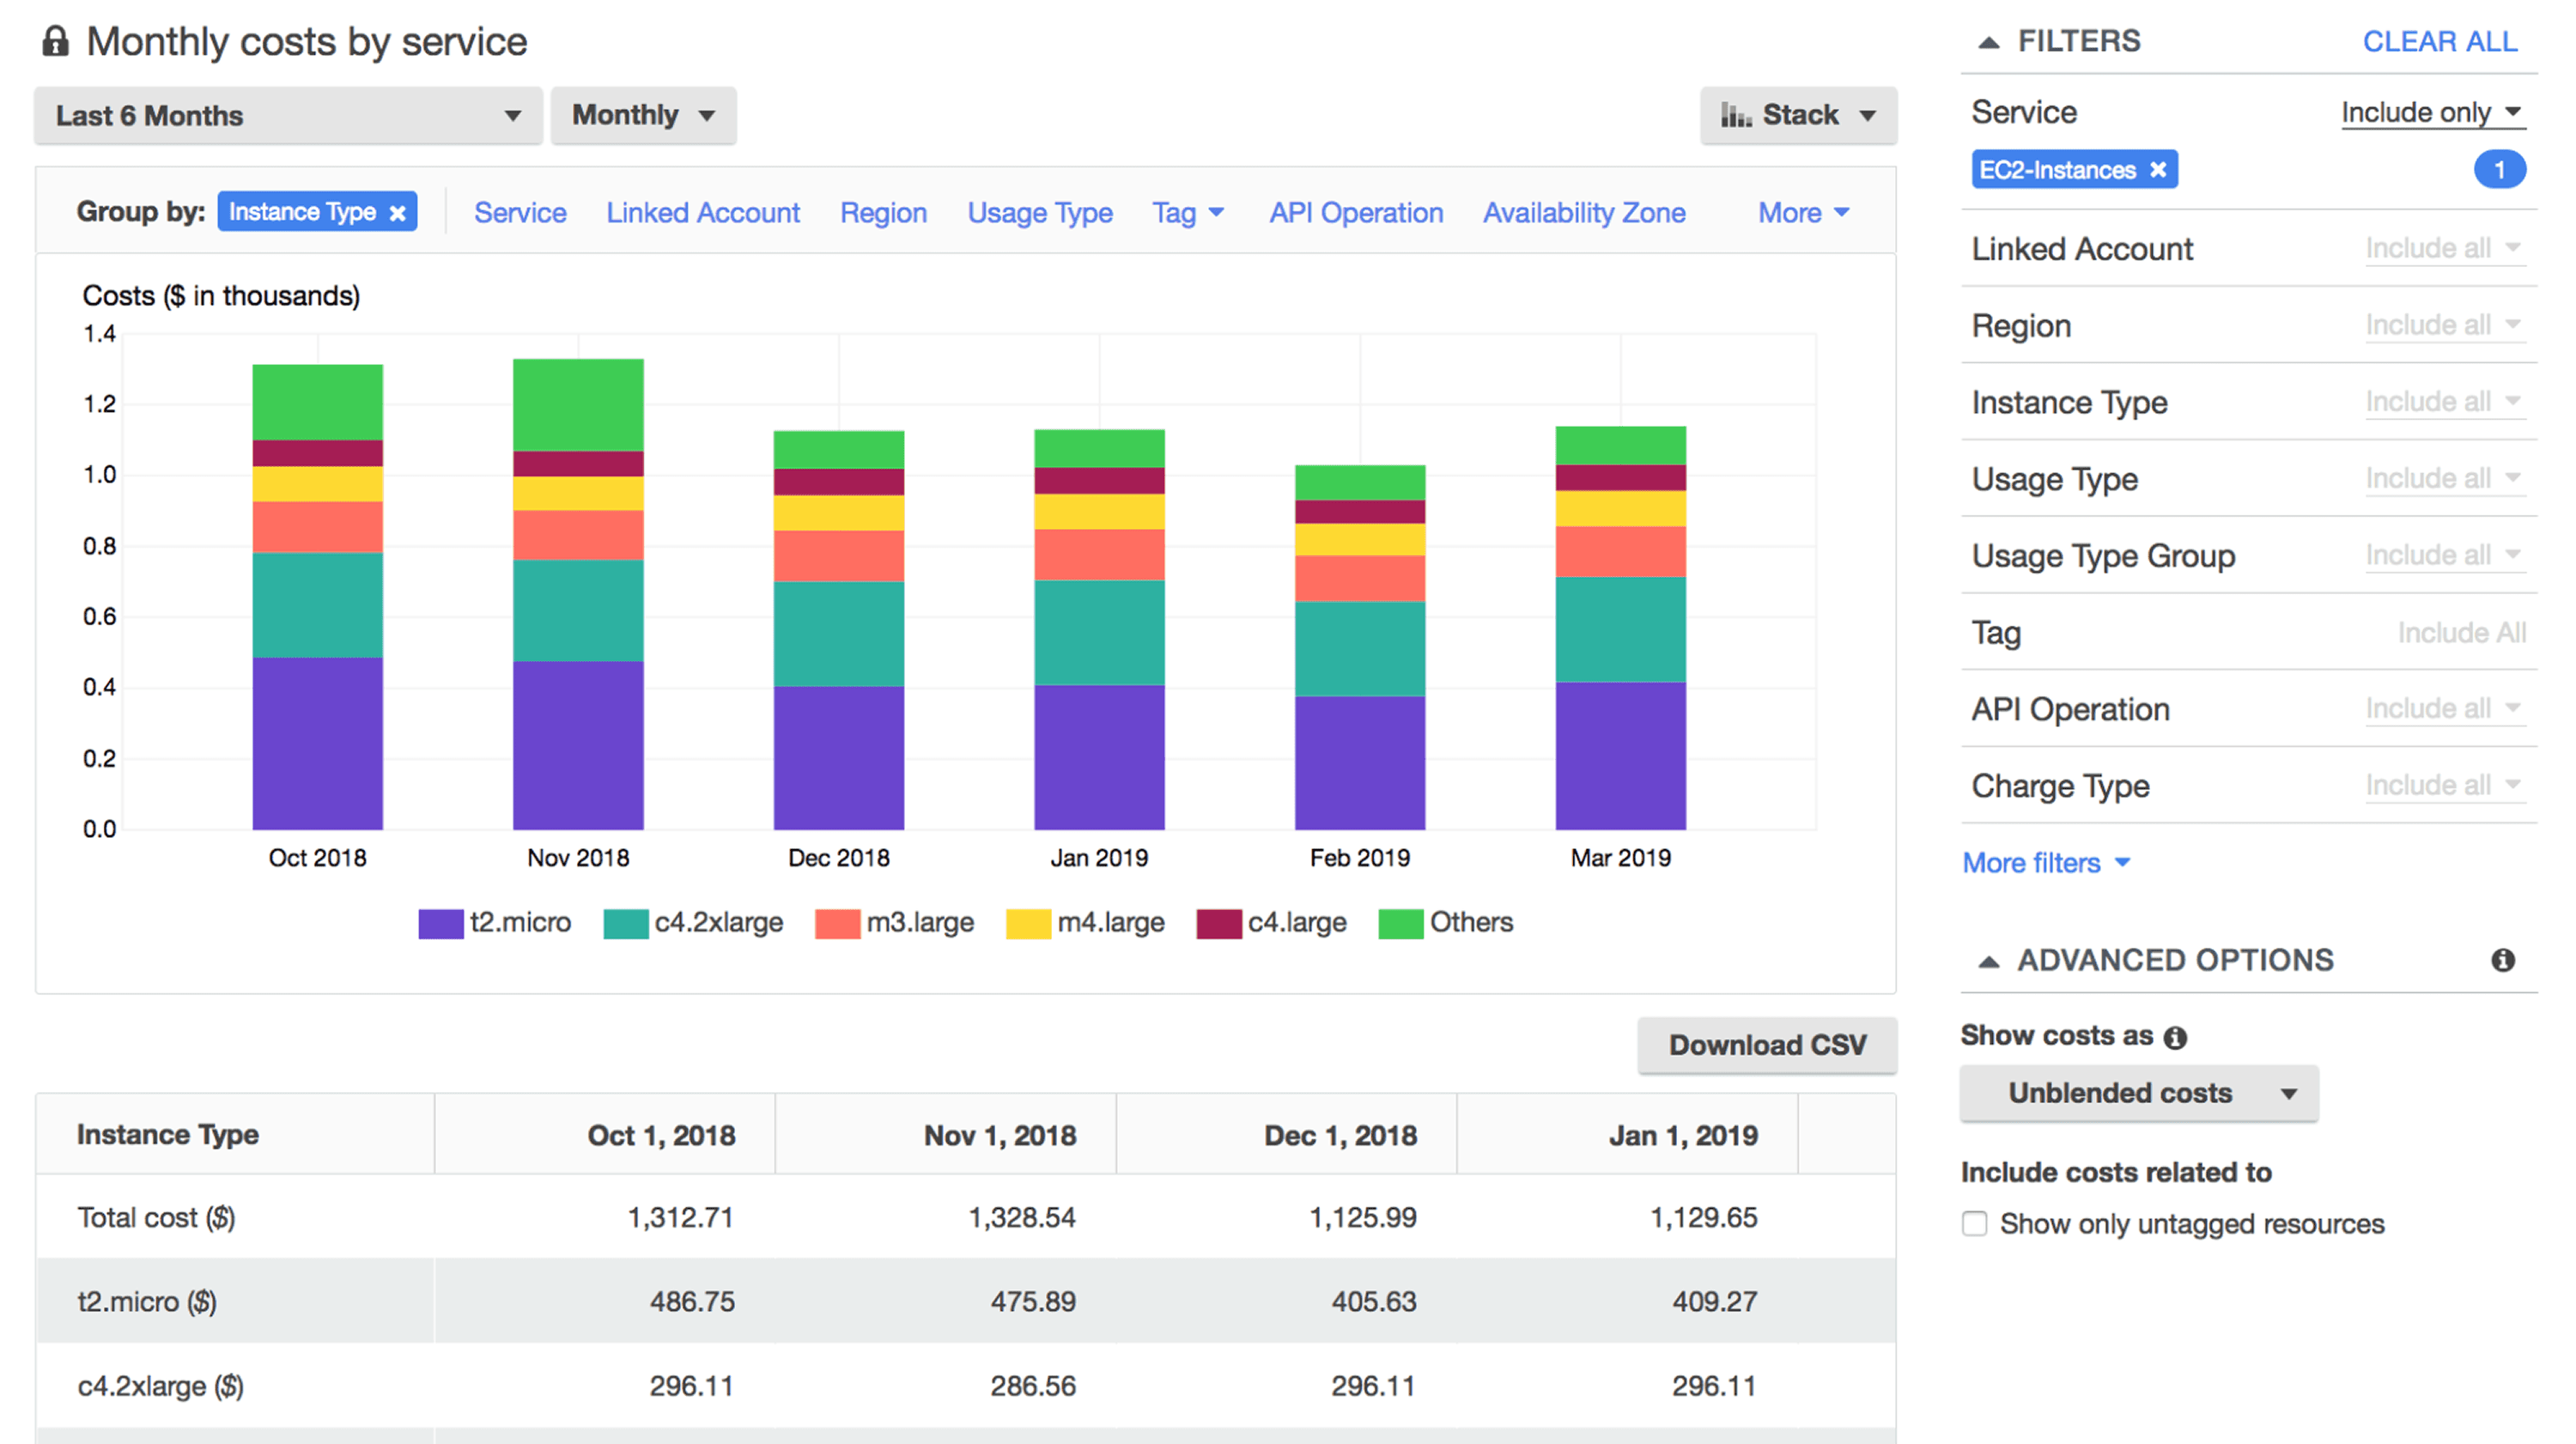
Gaining Multi-Cloud Visibility: See What You're Spending
Unified dashboards aggregate spend across providers, but effective visibility requires more than pretty charts.
Start with comprehensive tagging. Every resource needs tags identifying owner, project, environment, and cost center. A standardized schema might include:
# Standard tagging convention |
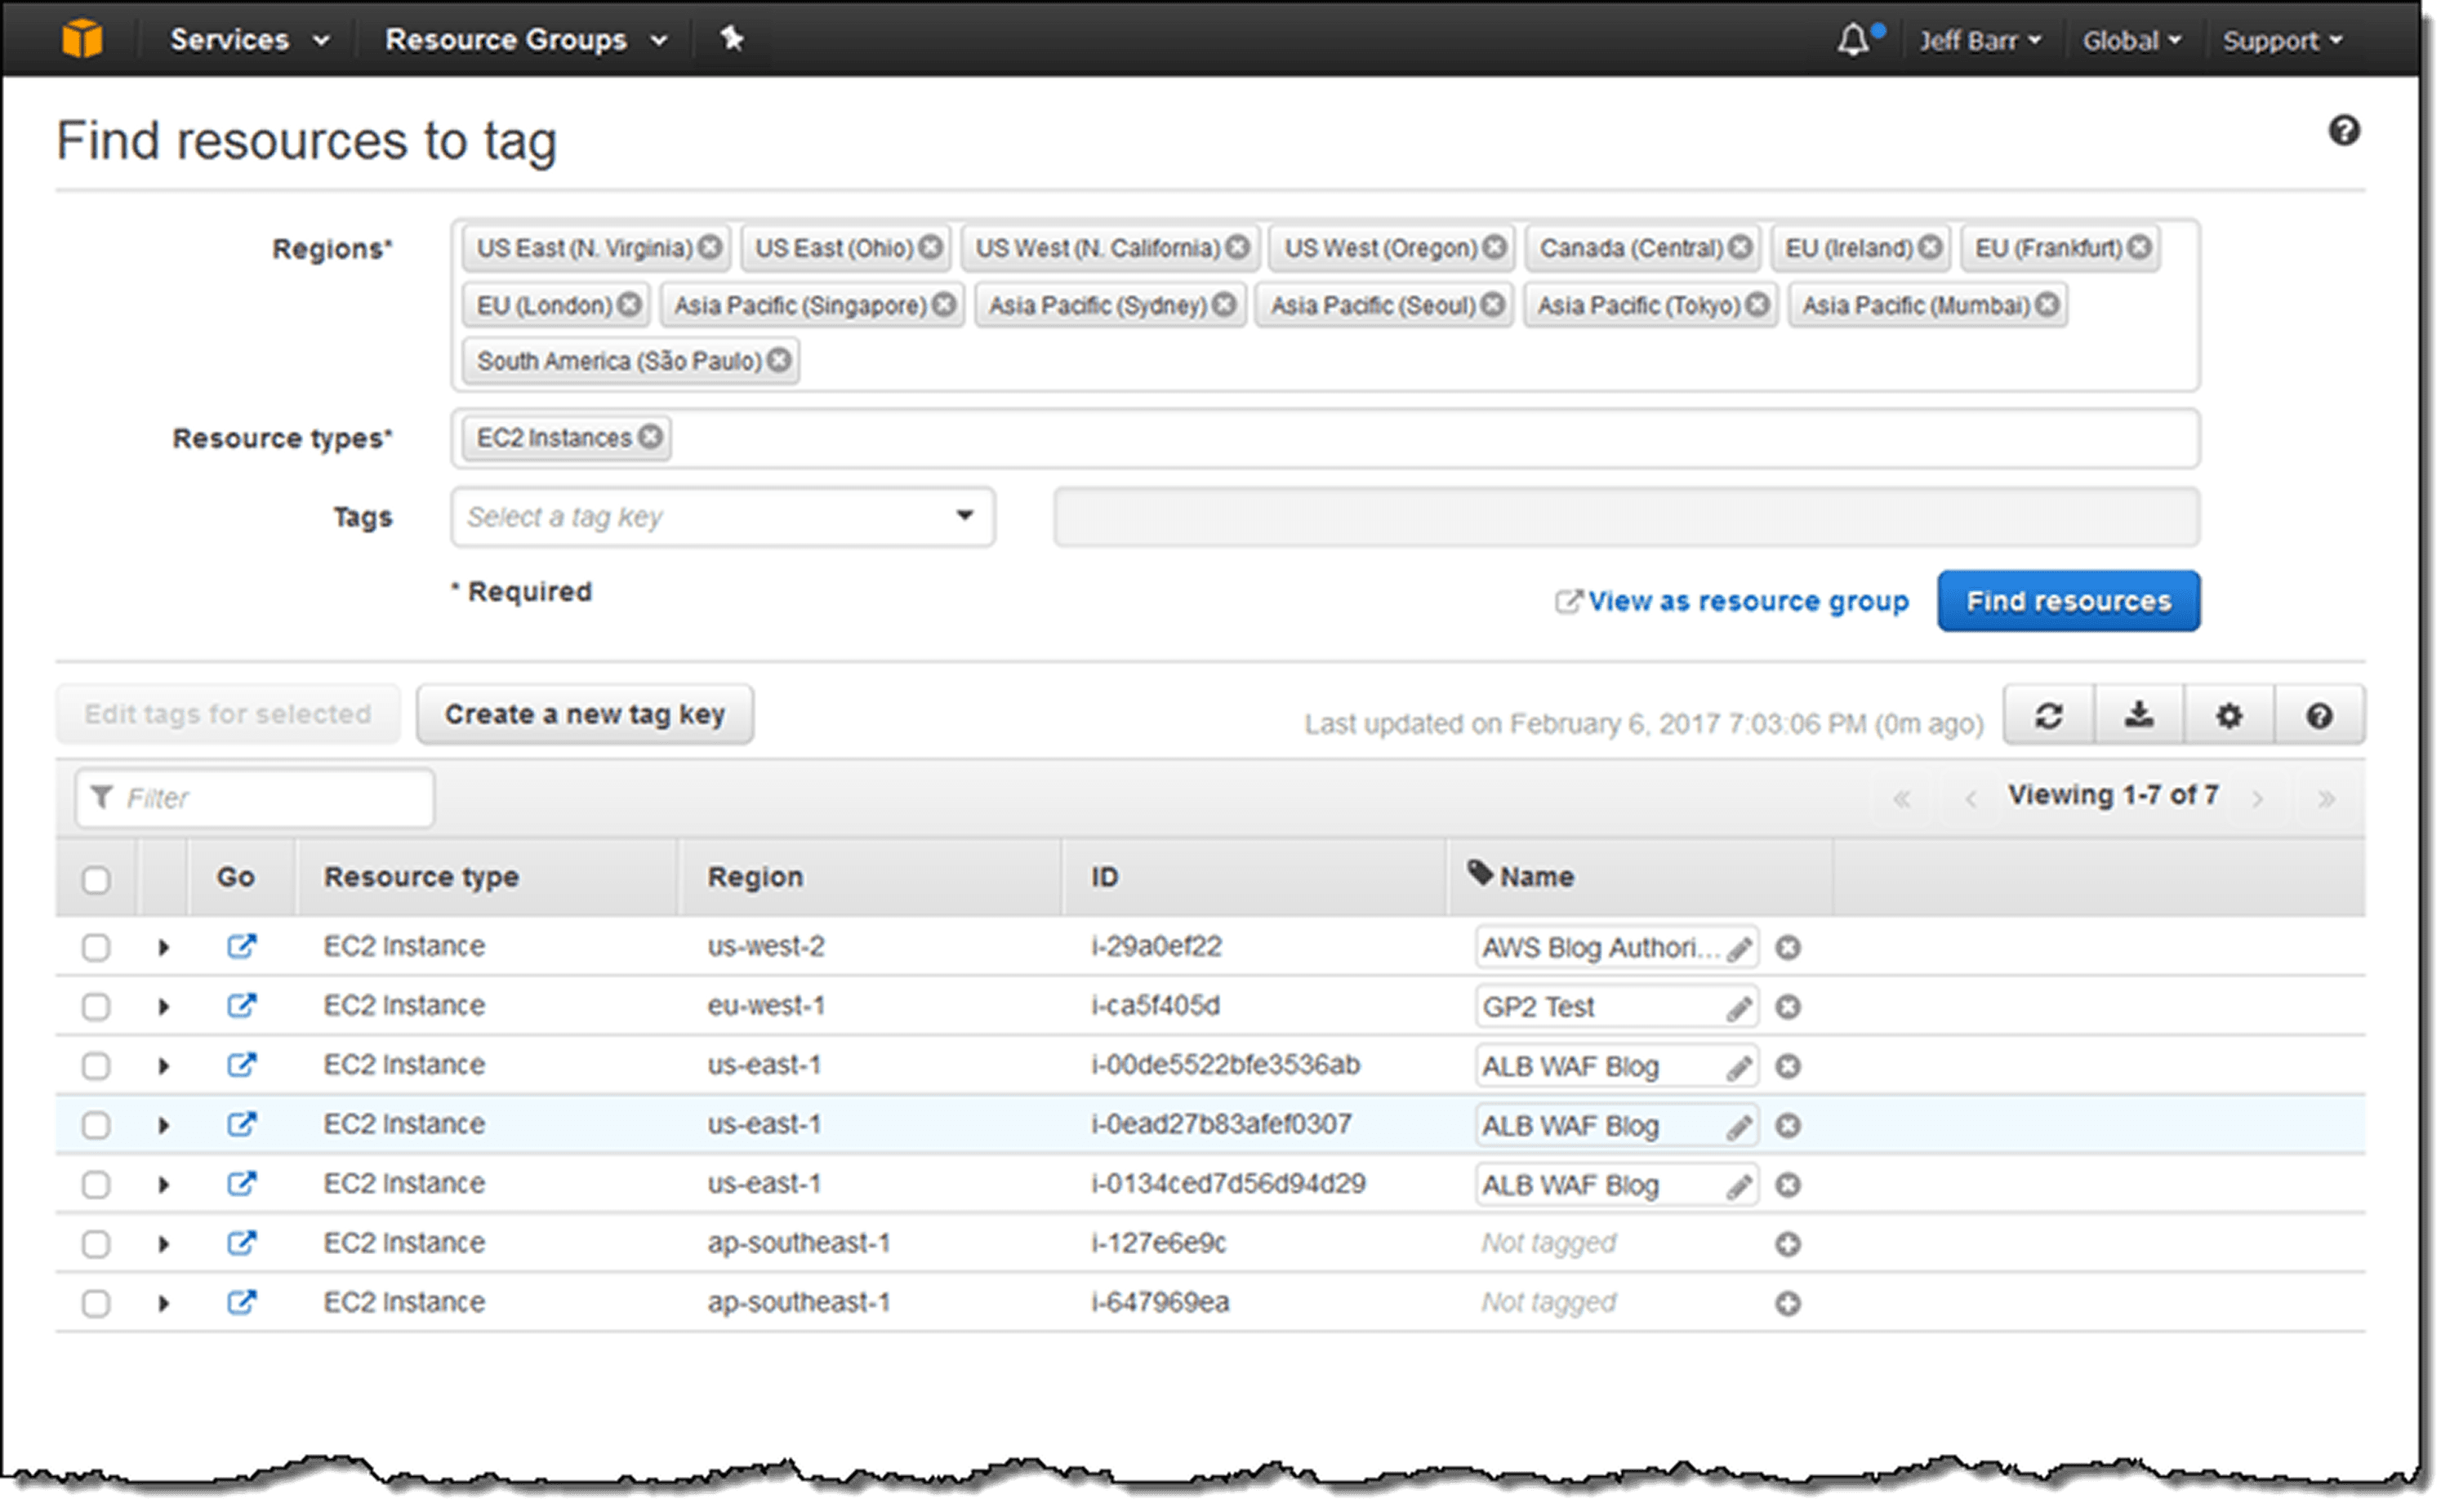
Implement these tags through automated policies. In AWS, use Service Control Policies enforcing tags at resource creation. Azure Policy and GCP Organization Policy achieve the same. Resources created without required tags should be rejected not tagged retroactively.
Real-time monitoring with anomaly detection catches spikes before month-end. Set baseline thresholds: if daily spending exceeds 20% of normal, alert immediately. One SaaS company discovered a misconfigured autoscaling group within 2 hours instead of at month-end, preventing $15K in waste.
Cost allocation models map spending to business units. Simple showback reports costs without charging teams. Chargeback models actually bill internal customers, creating accountability. Start with showback, chargeback introduces politics requiring executive sponsorship.
Rightsizing: Match Capacity to Actual Demand
Rightsizing analyzes utilization patterns, then adjusts instance types and sizes accordingly.
Most over-provisioning stems from one pattern: teams size for peak load without considering duration. Black Friday traffic spikes matter. Tuesday afternoon traffic variations don't justify constant oversizing.
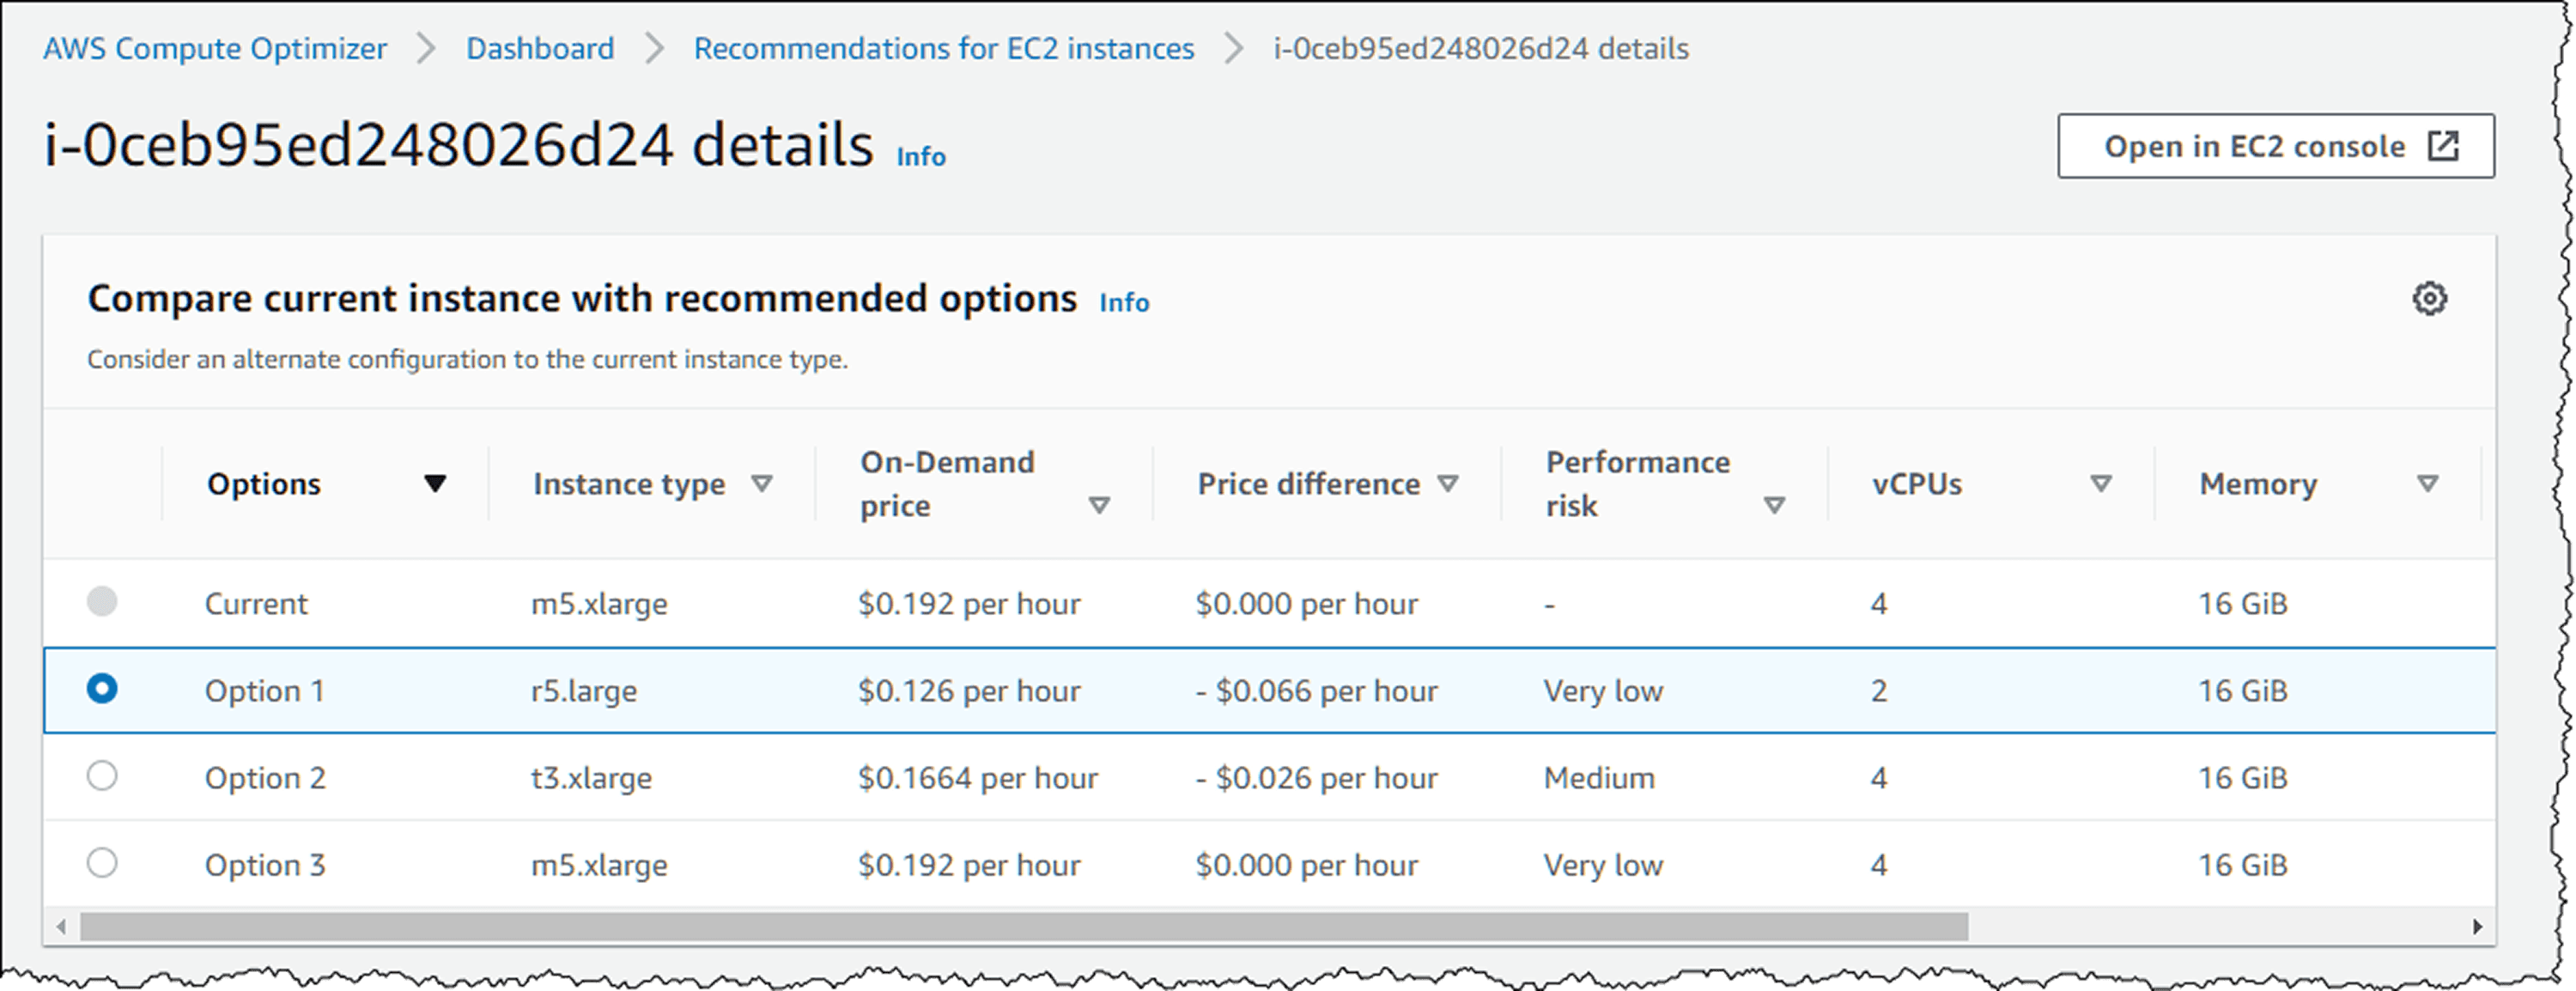
Analyze CPU, memory, and network utilization over 2-4 weeks minimum. Resources consistently under 40% CPU utilization are oversized. But don't rightsize based on maximum observed usage, that single spike might be anomalous. Look for the 95th percentile: what utilization occurs 95% of the time?
Native tools simplify this analysis. AWS Compute Optimizer provides instance-specific recommendations. Azure Advisor identifies underutilized VMs. GCP Recommender suggests machine type changes. These tools are free and continuously updated.
Implement changes gradually during low-traffic windows. When downsizing databases, test thoroughly storage IOPS changes with instance size, potentially impacting query performance in ways CPU metrics don't predict.
The decision framework: rightsize when workloads are steady. Autoscale when workloads are variable. Both together optimize comprehensively.
Eliminating Idle Resources: The Low-Hanging Fruit
Idle resources and forgotten experiments typically represent 15-25% of total spending.
Common culprits include:
Unattached EBS volumes from deleted instances
Elastic IPs not associated with running resources
Stopped instances still incurring storage charges
Load balancers with no targets
NAT gateways serving deleted VPCs
Test environments running continuously
Automated detection prevents accumulation. Schedule weekly scans identifying resources matching waste patterns. Tag resources at creation with expiration dates, if a test environment is needed for 2 weeks, tag it with an auto-delete date.
For non-production environments, implement scheduled shutdowns. Development and staging environments rarely need 24/7 availability. Running them only during business hours (8 AM - 8 PM weekdays) cuts costs by 70%.
Smart Commitment Management: Locking In Discounts
Reserved Instances and Savings Plans offer substantial discounts if used correctly.
The trade-off is commitment. You're pre-paying for capacity in exchange for lower rates. Make the wrong commitment and you're locked into unused capacity. Make too small a commitment and you're paying on-demand rates unnecessarily.
Commitment Type | Discount | Flexibility | Best For |
3-Year Reserved Instance | Up to 75% | Lowest | Stable production databases |
1-Year Reserved Instance | Up to 45% | Low | Predictable compute |
Compute Savings Plan | Up to 66% | Medium | EC2 flexibility needed |
EC2 Instance Savings Plan | Up to 72% | Medium-Low | Committed to instance family |
Start by analyzing 6-12 months of usage data. Identify your minimum consistent usage, the baseline that runs regardless of traffic variations. Commit to 70-80% of this minimum, not 100%. This leaves headroom for workload shifts while capturing most savings.
Track commitment coverage ratio (percentage of usage covered by commitments) and utilization rate (percentage of commitments actually used). Target 75-80% coverage with 95%+ utilization. Lower coverage means you're overpaying. Lower utilization means you're wasting commitments.
For organizations uncertain about long-term usage, prefer Savings Plans over Reserved Instances. The flexibility to change instance types, move between regions, or shift to containers provides valuable optionality worth the slightly smaller discount.
Leveraging Spot Instances: 90% Savings for Fault-Tolerant Workloads
Spot instances use spare cloud capacity at massive discounts. The catch: they can be interrupted with 2 minutes notice.
This makes them perfect for stateless, interruptible workloads like batch processing, CI/CD pipelines, containerized applications, and data processing jobs. One genomics company runs entire analysis pipelines on spot instances, saving $400K annually on compute-intensive workflows.
The architectural pattern: combine spot and on-demand capacity. Run 70-80% on spot for cost savings, 20-30% on-demand for reliability. When spot instances are reclaimed, traffic shifts to on-demand until new spot capacity becomes available.
Kubernetes makes this simple. Configure node groups with spot instances, set pod disruption budgets, and use cluster autoscaler. When spot nodes terminate, pods migrate to available capacity automatically.
Handle interruptions gracefully with checkpointing. For long-running jobs, save state every 5-10 minutes. When interrupted, resume from the last checkpoint instead of restarting completely.
Implementing Intelligent Autoscaling
Static provisioning means paying for peak capacity 24/7. Autoscaling means paying for what you actually use.
Horizontal scaling adds or removes instances based on metrics. Configure scale-out aggressively (add capacity quickly when demand rises) but scale-in conservatively (remove capacity slowly to avoid thrashing). Set scale-out at 70% CPU, scale-in at 30% CPU, with 5-minute cooldown preventing rapid oscillation.
Predictive autoscaling uses ML models to forecast demand, scaling proactively instead of reactively. If traffic spikes every Monday at 9 AM, predictive scaling adds capacity at 8:55 AM instead of waiting for the spike to trigger thresholds. AWS Auto Scaling, Azure Autoscale, and GCP Autoscaler all offer predictive modes.
For Kubernetes, combine Horizontal Pod Autoscaler (scales pods), Vertical Pod Autoscaler (adjusts resource requests), and Cluster Autoscaler (scales nodes). Together they optimize at all three layers.
Storage Optimization: Tiering and Lifecycle Management
Storage costs accumulate slowly, then suddenly. One analytics company discovered 800TB of logs in S3 costing $18K monthly with 90% never accessed after 30 days.
Cloud providers offer multiple storage tiers balancing cost and access speed:
Storage Class | Cost (per GB/month) | Access Time | Use Case |
Hot/Standard | $0.023 | Milliseconds | Active data |
Cool/Infrequent Access | $0.0125 | Milliseconds | Monthly access |
Archive/Glacier | $0.004 | Hours | Compliance retention |
Implement lifecycle policies automating data movement. A typical policy:
Days 0-30: Hot storage (frequent access expected)
Days 31-90: Cool storage (occasional access)
Days 91-365: Archive storage (rarely accessed)
After 365 days: Delete or move to deep archive
S3 Intelligent-Tiering automates this, monitoring access patterns and moving objects automatically. It adds $0.0025 per 1,000 objects monthly worthwhile when managing millions of objects manually becomes impractical.
For databases, compress older data. Time-series databases like InfluxDB or TimescaleDB offer automatic compression, reducing storage by 70-90% for historical data while maintaining query performance.
Building Cost-Aware Culture
Technology enables optimization. Culture sustains it.
Make cost a first-class metric alongside performance and reliability. Display cost dashboards in team areas. Review efficiency metrics in sprint retrospectives. Celebrate teams that achieve optimization wins.
Implement showback initially, then consider chargeback. Showback reports: "Your team's infrastructure costs $15K monthly." Chargeback actually bills: "Your team's budget is charged $15K." Showback raises awareness without introducing budgeting friction.
Cost efficiency KPIs tie optimization to team objectives. Track cost per user, per transaction, or per API call. When this metric improves, teams know they're optimizing successfully even if absolute spending increases due to growth.
Regular optimization reviews monthly or quarterly maintain momentum. Review top 10 spending services, investigate anomalies, discuss upcoming workload changes, and plan commitment purchases. Include engineering, finance, and business stakeholders. Cross-functional participation ensures optimization decisions balance technical and business requirements.
Your 90-Day Action Plan
Start with visibility (Days 1-30). Implement tagging standards, deploy unified cost dashboards, and analyze spending patterns. Identify top 10 cost drivers and obvious waste.
Find quick wins (Days 31-60). Eliminate idle resources, rightsize clearly oversized instances, and implement non-production environment scheduling. These changes deliver immediate ROI, building momentum and executive support.
Establish governance (Days 61-90). Deploy automated policies preventing future waste, set budget alerts with escalation procedures, and assign cost accountability to teams. Build continuous optimization into standard workflows.
The goal isn't one-time reduction. It's sustainable efficiency through systematic processes, automated controls, and cultural accountability.
FAQ
Q: What's the difference between Reserved Instances and Savings Plans?
A: Reserved Instances lock you into specific instance types and regions for discounts up to 75%, while Savings Plans offer similar savings with flexibility to change instance families and regions. Savings Plans suit dynamic environments; RIs fit stable, predictable workloads.
Q: Can I use spot instances for production workloads?
A: Yes, for fault-tolerant, stateless applications. Combine spot (70-80% of capacity) with on-demand instances (20-30%) for reliability. Implement graceful interruption handling and avoid spot for databases or single-point-of-failure components.
Q: How much can I realistically save through optimization?
A: Organizations implementing comprehensive strategies typically reduce costs 20-30%. Specific tactics vary: Reserved Instances offer 70-75% discounts, spot instances up to 90%, rightsizing 20-40%, and automated scheduling approximately 70% for non-production environments.
Q: How do I get started with FinOps?
A: Start with visibility. Implement comprehensive tagging, set up cost dashboards, establish budget alerts, and identify obvious waste like idle resources. Build awareness before pursuing complex optimization you can't optimize what you can't see.
Q: What are the biggest optimization mistakes to avoid?
A: Over-committing to Reserved Instances without understanding usage patterns, ignoring data transfer costs, treating optimization as one-time project instead of continuous process, and focusing solely on cost reduction without balancing performance requirements.
Ready to transform your cloud economics? Schedule a free cloud cost assessment with Opsolute's FinOps experts to identify your biggest optimization opportunities most organizations discover 20-30% savings potential in the first analysis.
Stop guessing what your AWS bill will be next quarter.
Connect your AWS Organization in under 30 minutes. Most customers see their first chargeback report in 14 days and realize a 5–10× return on Opsolute within 90 days.
