Published by
Opsolute Team
on
Introduction
If you run production workloads on Amazon EKS, you likely have untapped savings sitting in your cluster right now. Finding them requires more than high-level advice. This playbook combines observability through AWS tools, hands-on autoscaler configurations (Karpenter, Cluster Autoscaler, HPA, VPA), a decision matrix for Spot versus Fargate versus Reserved capacity, and a step-by-step rollout plan with real before-and-after numbers.
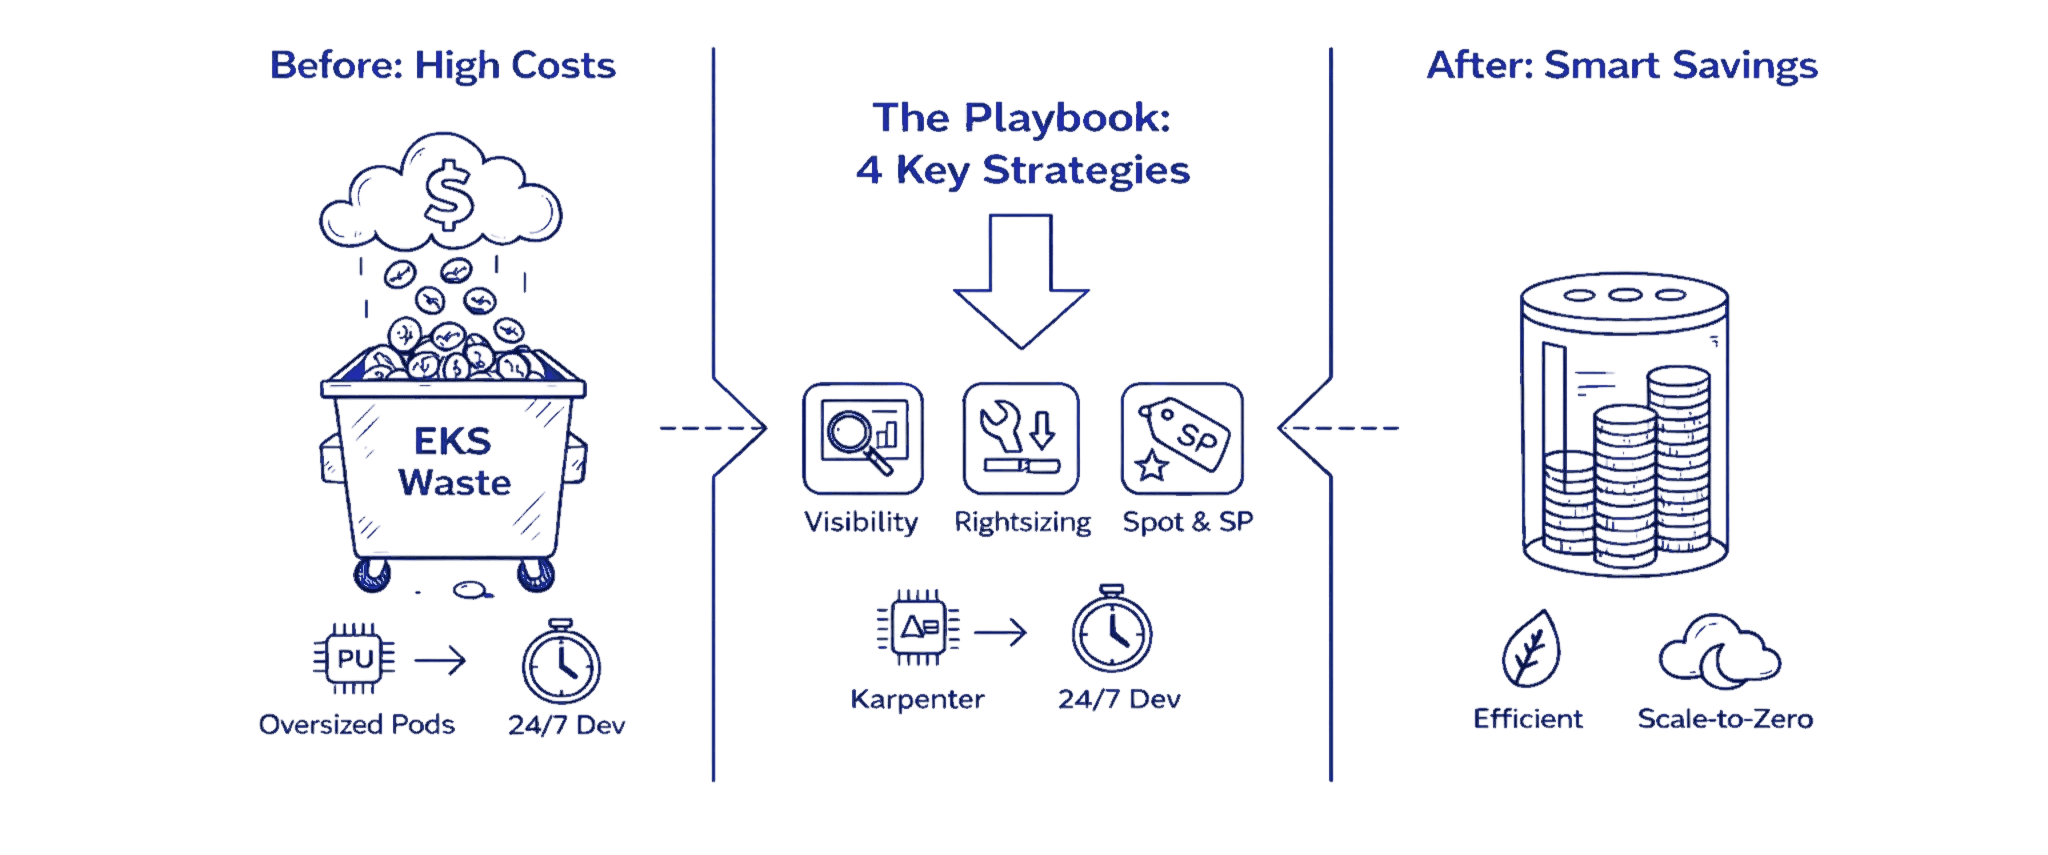
Before & After: Real Savings in 90 Days
A typical mid-size engineering team running 200 pods across 40 m5.large nodes spending $8,400 monthly can expect these results after implementing this playbook:
Before: $8,400/month
40 On-Demand m5.large nodes at 25% average utilization
Oversized pod requests
No autoscaling
Dev clusters running 24/7
After: $2,800/month
15 nodes via Karpenter (70% Spot, 30% On-Demand with Savings Plans)
Right-sized requests
Dev clusters scaled to zero overnight
Net Savings: $5,600/month (67% reduction)
This isn't hypothetical. Most teams implementing this playbook end-to-end achieve 50-70% cost reduction within three months.
Key Highlights
EKS cost waste primarily comes from oversized pods, idle EC2 nodes, orphaned EBS volumes, and unnecessary cross-AZ traffic
AWS Split Cost Allocation Data combined with native billing tools enables pod-level cost visibility and accurate attribution
Right-sizing pod requests typically cuts 30 to 40 percent of node capacity requirements
Karpenter delivers faster, cheaper autoscaling than Cluster Autoscaler and reduces compute costs by 30 to 50 percent
Spot Instances offer 60 to 90 percent savings for tolerant workloads when paired with proper PDBs and diversification
A hybrid compute strategy using On-Demand baseline, Spot variability, and Savings Plans commitments produces the largest long-term ROI
Most teams achieve 50 to 70 percent EKS savings in three months by implementing this playbook end to end
Why EKS Costs Spiral: Anatomy of Spend
The single biggest driver of EKS cost waste is mis-sized pod resource requests. When developers overestimate CPU and memory needs, often requesting 4 cores when workloads use only 1, Kubernetes provisions additional nodes to satisfy those inflated requests. This creates a cascade effect: more nodes lead to higher EC2 charges, more EBS volumes, increased cross-AZ traffic, and lower overall cluster utilization. Fixing pod resource requests first makes everything downstream significantly cheaper.
Understanding Cost Components
EKS spending breaks down into several key components, each with its own cost leaks:
EC2 Compute forms the largest expense category. When teams overprovision instance types or leave nodes running during idle periods, waste compounds quickly. A single m5.large instance running 24/7 costs roughly $70 monthly. Multiply that by dozens of underutilized nodes, and you're looking at thousands in unnecessary spend.
EBS Volumes accumulate silently. Developers provision persistent volumes for stateful workloads, but those volumes persist even after pods terminate, requiring regular S3 Cost Optimization and storage lifecycle controls across clusters. Orphaned EBS volumes charging $0.10 per GB-month add up to significant waste over time.
Data Transfer Costs catch teams off guard. Cross-AZ traffic within your VPC costs $0.01 per GB in each direction. For data-intensive applications processing terabytes monthly, this becomes a five-figure line item. NAT Gateway processing fees add another layer, charging $0.045 per GB processed.
EKS Control Plane costs $0.10 per hour per cluster, totaling $73 monthly. While this fee stays constant, running multiple clusters for different environments multiplies this base cost unnecessarily.
Common Cost Leaks
Oversized pod resource requests force Kubernetes to provision more nodes than workloads actually need. A pod requesting 4 CPU cores but using only 1 core wastes 75% of allocated capacity.
Abandoned workloads from completed experiments continue consuming resources months after teams stop caring about them.
Noisy neighbor problems arise when resource-intensive pods land on shared nodes, forcing other workloads onto additional instances.
Quick Decision Matrix: Workload → Autoscaler → Compute
Workload Type | Best Autoscaler | Compute Strategy | Expected Savings |
Stateless web apps | Karpenter + HPA | 70% Spot, 30% On-Demand | 60-75% |
Batch/CI-CD | Karpenter | 90% Spot, 10% On-Demand | 75-85% |
Databases/stateful | Cluster Autoscaler | 100% On-Demand + Savings Plans | 40-50% |
ML inference | Karpenter | 50% Spot, 50% On-Demand | 50-60% |
Low-traffic services | Fargate | Pay-per-use | 20% (ops efficiency gain) |
Development/staging | Karpenter | 100% Spot, scale-to-zero | 80-90% |
Fargate Trade-off: ~20% higher compute cost for 80% reduction in operational overhead. Choose when operational simplicity justifies the premium.
Observe: Visibility and Allocation
You cannot optimize what you cannot measure. Establishing cost visibility requires connecting AWS billing data with Kubernetes resource allocation using structured Cloud Cost Allocation Methods.
Enable AWS Split Cost Allocation Data
AWS Split Cost Allocation Data for EKS provides native, granular cost visibility down to the pod level. As of October 2025, this feature now supports importing up to 50 Kubernetes custom labels per pod as cost allocation tags.
Setup Steps:
Navigate to AWS Billing Console → Cost Management Preferences
Enable Split Cost Allocation Data for Amazon EKS
Choose your measurement method:
Resource requests (recommended): Allocates costs based on CPU/memory requests
Amazon Managed Service for Prometheus: Uses actual utilization metrics
CloudWatch Container Insights: Provides more granular visibility
For accelerated computing workloads (GPU, Trainium, Inferentia): Split cost allocation automatically tracks these resources alongside CPU and memory (feature added September 2025)
Enable Cost and Usage Reports (CUR) delivery to an S3 bucket with hourly granularity
Configure Cost Visualization
After enabling split cost allocation (data appears within 24 hours):
Use AWS Cost Explorer for basic visualization:
Filter by
aws:eks:cluster-name,aws:eks:namespace,aws:eks:workload-nameGroup costs by custom Kubernetes labels imported as tags
Set up Cost Anomaly Detection for automatic alerts
For Advanced Analysis:
Deploy the Containers Cost Allocation Dashboard in Amazon QuickSight
Query CUR data using Amazon Athena for custom reports
Create Cost Categories to map Kubernetes costs to business units
Map Billing to Kubernetes
Establish consistent labeling across all workloads:
metadata: |
These labels automatically appear in CUR as resourceTags/kubernetes.io/team, resourceTags/kubernetes.io/environment, etc., enabling precise cost allocation and chargeback.
Quick Wins: Low-Effort High-Impact Changes
Several optimization tactics deliver immediate savings with minimal implementation effort.
1. Tune Resource Requests and Limits
Analyze actual pod consumption using kubectl top pods to compare requested resources against actual usage. A pod requesting 2 CPU cores but averaging 0.5 cores wastes 75% of its allocation.
resources: |
This change alone can reduce required node capacity by 30-40% in over-provisioned clusters.
2. Scale Down Development Clusters
Development and testing environments rarely need full capacity overnight. Implement cluster schedulers or simple cron jobs:
# Scale down at 7 PM |
3. Remove Abandoned Workloads
Audit deployments that haven't been updated in 90+ days:
kubectl get deployments --all-namespaces \ |
This housekeeping typically recovers 10-15% of cluster capacity.
4. Choose Right-Sized Node Types
Analyze workload patterns to select optimal instances:
Memory-intensive: r5 instances provide more RAM per dollar
Compute-bound: c5 instances offer more CPU capacity
Burstable workloads: t3/t4g instances save costs during idle periods
Autoscaling Deep Dive: Karpenter vs Cluster Autoscaler
Cluster Autoscaler: Stable and Predictable
The traditional choice that monitors pending pods and scales Auto Scaling Groups.
Setup:
apiVersion: apps/v1 |
Characteristics:
Scale-up latency: 2-5 minutes
Average utilization: 25-40%
Works within predefined node groups
Mature, stable, multi-cloud portable
Karpenter: Fast and Flexible (Recommended for AWS)
Provisions nodes directly via EC2 APIs, selecting optimal instance types based on pending pod requirements. As of July 2025, Karpenter v1.5 introduced faster bin-packing and "emptiness-first" consolidation.
Basic NodePool Configuration:
apiVersion: karpenter.sh/v1beta1 |
Performance Advantages:
Scale-up latency: 45-60 seconds (vs 2-5 minutes for CA)
Average utilization: 60-70% (vs 25-40% for CA)
Cost reduction: Real-world teams report 20-30% cluster-wide savings, up to 90% for CI/CD workloads
Intelligent bin-packing: Consolidates workloads aggressively without breaking SLOs
Decision Framework
Choose Cluster Autoscaler when:
You need multi-cloud portability
Regulatory requirements mandate managed node group controls
Workload patterns are highly predictable
Team prefers proven, stable technology
Choose Karpenter when:
Optimizing aggressively for cost on AWS
Requiring fast scale-up response (<60s)
Running substantial Spot Instance workloads
Need flexible instance type selection
Horizontal and Vertical Pod Autoscalers
HPA scales pod replicas based on metrics:
apiVersion: autoscaling/v2 |
VPA adjusts pod resource requests automatically:
apiVersion: autoscaling.k8s.io/v1 |
VPA analyzes historical usage and right-sizes requests, eliminating guesswork.
Compute Choice Matrix: Spot, On-Demand, Fargate, and Commitments
Spot Instances: 60-90% Savings
Spot Instances offer dramatic discounts on spare EC2 capacity. They work exceptionally well for fault-tolerant workloads like batch processing, CI/CD pipelines, and stateless web services.
Configure Spot-friendly NodePools with diversification:
apiVersion: karpenter.sh/v1beta1 |
Implement Pod Disruption Budgets:
apiVersion: policy/v1 |
Real-world Spot adoption typically delivers 60-75% cost reduction for suitable workloads.
On-Demand Instances: Guaranteed Availability
Use for critical workloads requiring guaranteed availability:
Databases and stateful applications
Message queues
Application pods that cannot tolerate interruptions
Price predictability and instant availability justify the premium cost.
AWS Fargate: Zero Infrastructure Management
Fargate eliminates node management entirely, charging only for pod vCPU and memory consumption.
Pricing (as of December 2025):
$0.04048 per vCPU-hour
$0.004445 per GB-hour
Trade-off: Approximately 20% higher compute costs than equivalent EC2 instances, but removes 80% of operational overhead—no node patching, no capacity planning, no autoscaler configuration.
Consider Fargate when:
Operational simplicity justifies the premium
Running low-traffic services or scheduled jobs
Small teams without dedicated infrastructure engineers
Need instant scaling without pre-provisioned capacity
For cost-sensitive production workloads at scale, EC2 with Karpenter delivers better economics.
Savings Plans and Reserved Instances: 40-72% Discounts
Apply commitments to baseline capacity:
Compute Savings Plans: Flexibility across instance families and regions (40-50% discount)
Reserved Instances: Slightly higher discounts (up to 72%) but locked to specific instance types
Strategy: Purchase Savings Plans for predictable baseline capacity, use Spot for variable demand.
Tagging and Cost Allocation Best Practices
Establish a tagging taxonomy covering:
Team: Engineering team responsible
Environment: Production, staging, development
Application: Specific service name
Cost-center: Business unit for chargeback
apiVersion: v1 |
AWS Split Cost Allocation automatically imports these labels as tags with the prefix resourceTags/kubernetes.io/, enabling filtered analysis in Cost Explorer and CUR queries.
KPIs, Alerts, and Guardrails for FinOps
Track These Metrics
Cost per namespace: Monthly spend attributed to each Kubernetes namespace
Cost per pod: Average cost per running pod
CPU/Memory efficiency: Ratio of utilized resources to requested resources
Idle node percentage: Proportion of provisioned capacity unused
Wasted spend: Dollar value of over-provisioned resources
Configure Budget Alerts
Use AWS Budgets with Cost Anomaly Detection:
# Set budget threshold |
Set Karpenter Limits
Prevent runaway scaling:
spec: |
Get Expert Help
Organizations implementing this playbook typically reduce EKS costs by 50-70% within three months. The combination of visibility, right-sizing, intelligent autoscaling, and strategic use of Spot Instances delivers sustainable savings without compromising reliability.
Ready to uncover your hidden EKS savings? Visit Opsolute or book a free assessment to get started.
Opsolute provides comprehensive EKS cost optimization as a service, combining automated analysis, expert recommendations, and hands-on implementation support to help you achieve these savings faster with less risk.
Stop guessing what your AWS bill will be next quarter.
Connect your AWS Organization in under 30 minutes. Most customers see their first chargeback report in 14 days and realize a 5–10× return on Opsolute within 90 days.
