Published by
Vishnu Siddarth
on

Introduction
Cloud teams struggle to turn raw bills into reliable business metrics. Should you push tags and build bottom-up pipelines, or use top-down allocation to get unit costs quickly? This guide provides a clear decision checklist, worked numeric examples, AWS quickstarts, and sample SQL/FOCUS mappings to help you choose and implement the right approach to Forecasting Cloud Costs.
Key Highlights
Most organizations still fail to allocate even 75 percent of their cloud spend, leaving millions unowned and unaccounted for
Top-down allocation delivers fast unit economics such as cost per customer or transaction even when tagging is weak
Bottom-up allocation provides granular accuracy but demands strict tagging, enforcement automation, and ongoing engineering capacity
A hybrid model helps validate one approach against the other and exposes blind spots like untagged dev environments or shared infrastructure
Shared costs such as networking, support, and commitments require structured allocation rules using proportional, fixed, or weighted drivers
Effective allocation enables product-level accountability, accurate forecasting, and reduces variance to under 5 percent at run maturity
Effective cost allocation isn't an end goal, it's the foundation for accurate forecasting (predicting spend based on customer growth), Unit Cost Considerations (optimizing cost per transaction), right-sizing commitments (purchasing Reserved Instances and Savings Plans with confidence), and product-level P&L reporting. Without reliable allocation, these downstream FinOps capabilities remain guesswork.
AWS FOCUS exports, CUR, Cost Categories, and Athena form the backbone for both top-down and bottom-up allocation workflows
Organizations can achieve meaningful results in 30–90 days by following a structured discovery, pilot, and scale-out plan
The Cost Allocation Crisis
In 2024, 78% of companies have less than 75% of their cloud spend allocated, with only one in four achieving 100% resource allocation. This alarming gap represents billions of dollars in untracked spending flowing through organizations without clear ownership or accountability.
The fundamental challenge isn't just tracking costs; it's attributing them meaningfully. Cost allocation matches what you spend with who you spend it on, giving you business-relevant metrics like cost per customer, cost per product, and cost per feature. Without this clarity, engineering teams build without financial constraints, finance struggles to forecast accurately, and executives lack the insights needed for strategic decisions.
Top-down allocation typically achieves ±10-15% variance at crawl maturity, tightening to ±5-10% at run. Bottom-up allocation delivers ±3-5% variance once fully implemented but requires 6-12 months of tagging discipline to reach that precision. Understanding these tolerances upfront prevents teams from pursuing false precision or abandoning viable approaches prematurely.
Understanding the Two Approaches
Top-Down Allocation: Start Broad, Drill Deep
Top-down allocation starts broad, focusing on the highest-impact areas first, and gets more granular based on results and experience. Think of it as using radar to identify promising areas before dropping anchor.
The approach works by:
Aggregating total cloud spend from billing sources
Mapping high-level business telemetry (customers, transactions, API calls)
Distributing costs proportionally based on usage drivers
Refining with additional metrics as maturity increases
With a single metric, you dynamically allocate all spend from all cloud services and resources within. After starting with cost per customer, you can progress to cost per product per customer, then cost per feature per product per customer.
Bottom-Up Allocation: Build From Resources
Bottom-up allocation starts at the most granular resource level (individual EC2 instances, Lambda functions, S3 buckets requiring S3 Cost Optimization) and aggregates upward through comprehensive tagging.
Critical: Bottom-up allocation is an ongoing governance system, not a one-time tagging project. Tag enforcement, compliance monitoring, and drift correction require sustained engineering investment. Organizations that treat tagging as a sprint rather than a permanent practice see coverage decay from 80% to below 50% within 6 months.
The foundation requires:
Rigorous tagging strategy: Every resource tagged with cost center, project, environment, owner
Tag enforcement: Automated policies ensuring compliance at resource creation
Aggregation logic: Roll-up rules to group tagged resources into business units
Tags or labels applied within the cloud enhance allocation granularity, while even more granular allocation of shared cost elements can be accomplished using organizational CMDB, observability, or utilization data.
Decision Checklist: Which Approach Fits Your Reality?
Use this 10-minute workshop checklist to determine your path:
1. What Business Metric Are We Solving For?
Top-down indicators:
Cost per customer or tenant
Cost per transaction or API call
Product-level unit economics
When telemetry exists but tagging doesn't
Bottom-up indicators:
Department or team chargebacks
Project-level cost tracking
Environment-specific spending (prod vs. dev)
When organizational structure drives allocation
2. Assess Your Current Tag Coverage
At crawl maturity, tags may be used for some cost allocation but not consistently or for the majority of spend.
If tag coverage is below 50%: Top-down provides faster time-to-value while you build tagging discipline.
If tag coverage exceeds 75%: Bottom-up leverages existing investment and provides granular accuracy.
3. Evaluate Telemetry Availability
Available telemetry sources:
Application logs with customer/tenant identifiers
API gateways with request counts
Load balancer metrics
Database query patterns
Transaction processing volumes
If you have reliable telemetry correlating to business value, top-down allocation becomes immediately viable.
4. Consider Your SLA Requirements
Immediate need (30-90 days): With top-down spend, you get usable information with just one metric and then dive as deep as you want. This speed advantage matters when leadership demands answers quickly.
Building for precision (6-12 months): Bottom-up provides the infrastructure for long-term, highly accurate cost attribution once fully implemented.
5. Assess Engineering Capacity
Starting tagging too late means tags applied after resource creation don't retroactively track costs, leaving gaps in cost history.
Limited engineering resources: Top-down requires less hands-on resource management and tag maintenance.
Dedicated FinOps engineering: Bottom-up justifies the investment when you have teams to manage tagging automation and enforcement.
Worked Numerical Examples
Example 1: Top-Down Cost-Per-Customer Calculation
Scenario: A SaaS platform with 10,000 active customers and $500,000 monthly AWS spend.
Step 1 - Aggregate Total Spend:
Total Monthly Spend: $500,000
Step 2 - Identify Allocation Driver: From application logs, extract monthly API requests per customer:
Total API Requests: 50,000,000 |
Step 3 - Calculate Proportional Cost:
Customer A Cost: $500,000 × 0.05 = $25,000 |
Validation: Compare allocated spend against actual billed amount. At run maturity, there are few scenarios where all cost is not allocated at the most granular level or is unidentified, requiring essentially no research.
Error bounds: Expect ±10-15% variance initially as you refine allocation drivers and account for shared infrastructure.
Example 2: Bottom-Up Project Cost Aggregation
Scenario: An organization with 3 projects, using comprehensive tagging.
Tagged Resources:
Project: ProjectAlpha |
Unallocated Costs (shared infrastructure):
VPC networking: $3,000 |
Allocation Strategy: Distribute unallocated costs proportionally by compute usage:
ProjectAlpha proportion: 10/30 = 33.3% |
Validation check: $7,700 + $4,500 + $9,600 + $6,200 = $28,000 total spend, all allocated.
Example 3: Hybrid Approach Reconciliation
Sophisticated organizations use hybrid allocation not as a compromise but as a validation system. Start with top-down for immediate visibility, then validate against bottom-up tagged resources to expose blind spots:
Top-Down Calculated (by customer usage): $480,000 Bottom-Up Tagged Resources: $465,000 Variance: $15,000 (3.1%)
|
Reconciliation outcome: Refine top-down allocation factors while improving bottom-up tag coverage to close the gap to under 5%. This cross-validation catches untagged resources, incorrect allocation drivers, and shared cost blind spots that single-method approaches miss.
Top-Down Implementation Playbook
Phase 1: Bill Aggregation & Normalization (Week 1-2)
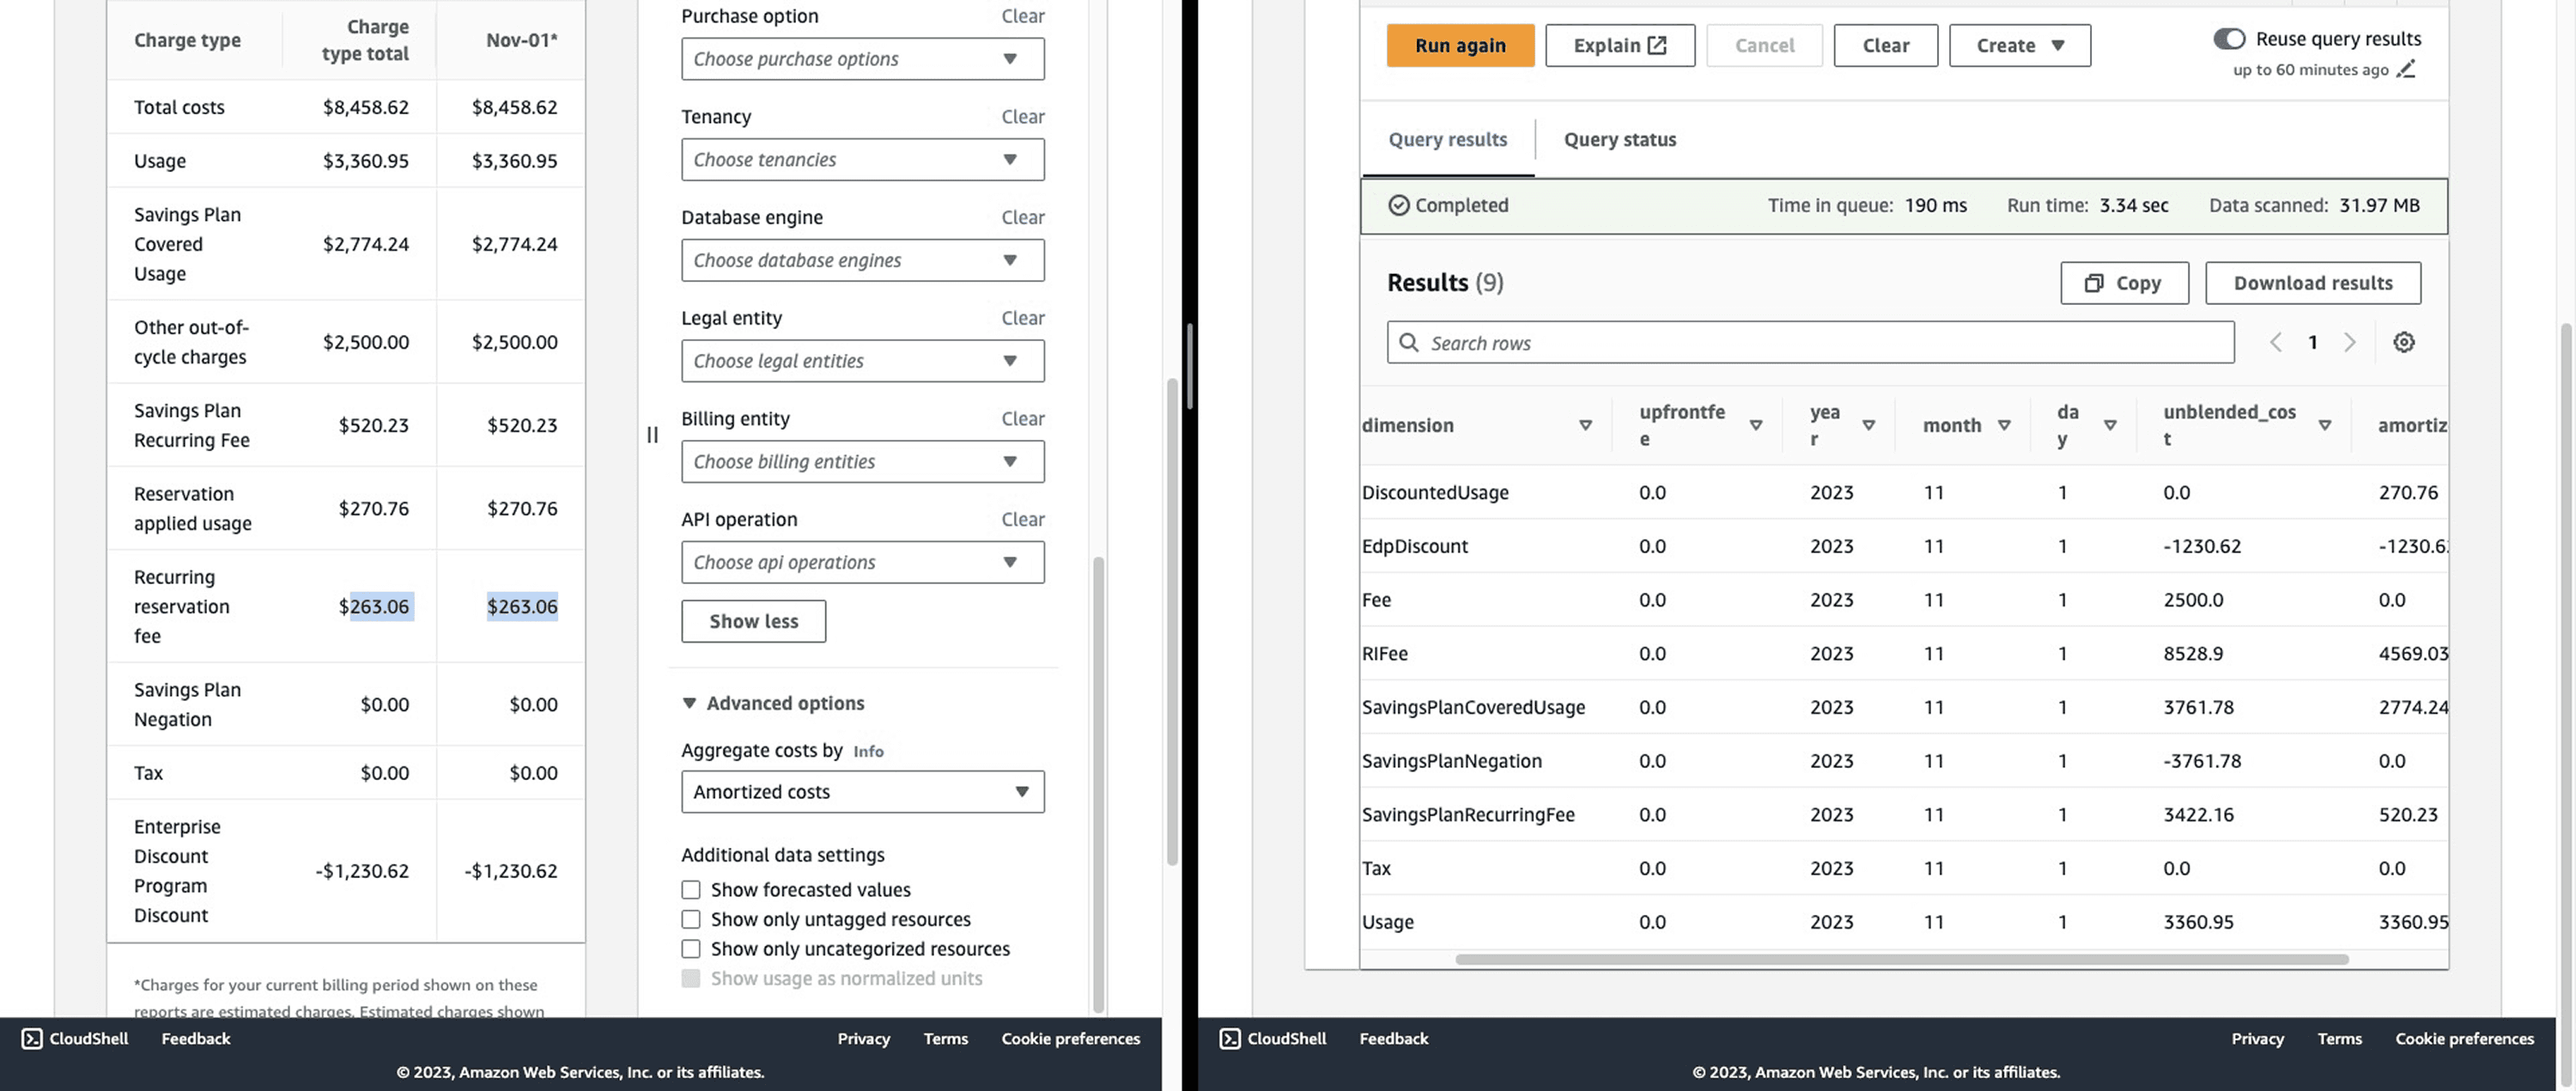
With Data Exports for FOCUS 1.0, you can configure recurring delivery of AWS cost and usage data with the FOCUS schema to your designated S3 bucket for cost reporting and allocation.
Actions:
Enable AWS Cost and Usage Report (CUR) or FOCUS exports
Configure S3 bucket for automated delivery
Set up Athena or QuickSight for querying
Key CUR columns for top-down:
SELECT |
Phase 2: Business Telemetry Integration (Week 3-4)
Identify allocation drivers:
Active users/customers from CRM
Transaction volumes from payment systems
API calls from gateway logs
Compute seconds from container orchestration
Storage GB from data platform metrics
Example telemetry extraction:
# Pseudo-code for customer usage extraction |
Phase 3: Allocation Rules & Calculation (Week 5-6)
Define allocation methodology:
Proportional: Distribute costs based on usage percentage
Weighted: Combine multiple factors (CPU + memory + network)
Tiered: Apply different rates for different service levels
Sample allocation calculation:
/* |
Phase 4: Validation & Refinement (Ongoing)
Validation checks:
Sum of allocated costs matches total bill (±2%)
Month-over-month trend analysis for reasonableness
Spot-check largest customers against expected usage patterns
Review unallocated shared cost percentages
According to the FinOps Community of Practitioners, comprehensive allocation translates to at least 80% of cloud spend allocated for a FinOps practice at crawl maturity and 90% at run maturity.
Bottom-Up Implementation Playbook
Phase 1: Tagging Strategy Design (Week 1-2)
Create a clear policy that outlines which tags are required and which are optional, how they should be applied, and who is responsible for tagging resources.
Required tags (organization standard):
Required: |
Tag naming conventions:
Use PascalCase for consistency
Limit to 20-30 character keys
Standardize values (use dropdown in IaC)
Document in central wiki or repository
Phase 2: Tag Enforcement Automation (Week 3-5)
Infrastructure as Code (IaC) enforcement:
# Terraform example: mandatory tags |
AWS Config Rules for runtime enforcement:
/* |
Phase 3: Tag Compliance Monitoring (Week 6-7)
Cost allocation tags must be activated in the Billing and Cost Management console to appear in cost reports, and it can take up to 24 hours for tags to reflect in billing information after activation.
Compliance KPIs:
-- Tag coverage percentage |
Target metrics (by maturity):
Crawl: 50-60% tag coverage
Walk: 75-85% tag coverage
Run: 90%+ tag coverage
Phase 4: Cost Aggregation & Reporting (Week 8+)
Sample aggregation query:
SELECT |
AWS Quickstart: Cost Categories, FOCUS & CUR
Enabling FOCUS Exports
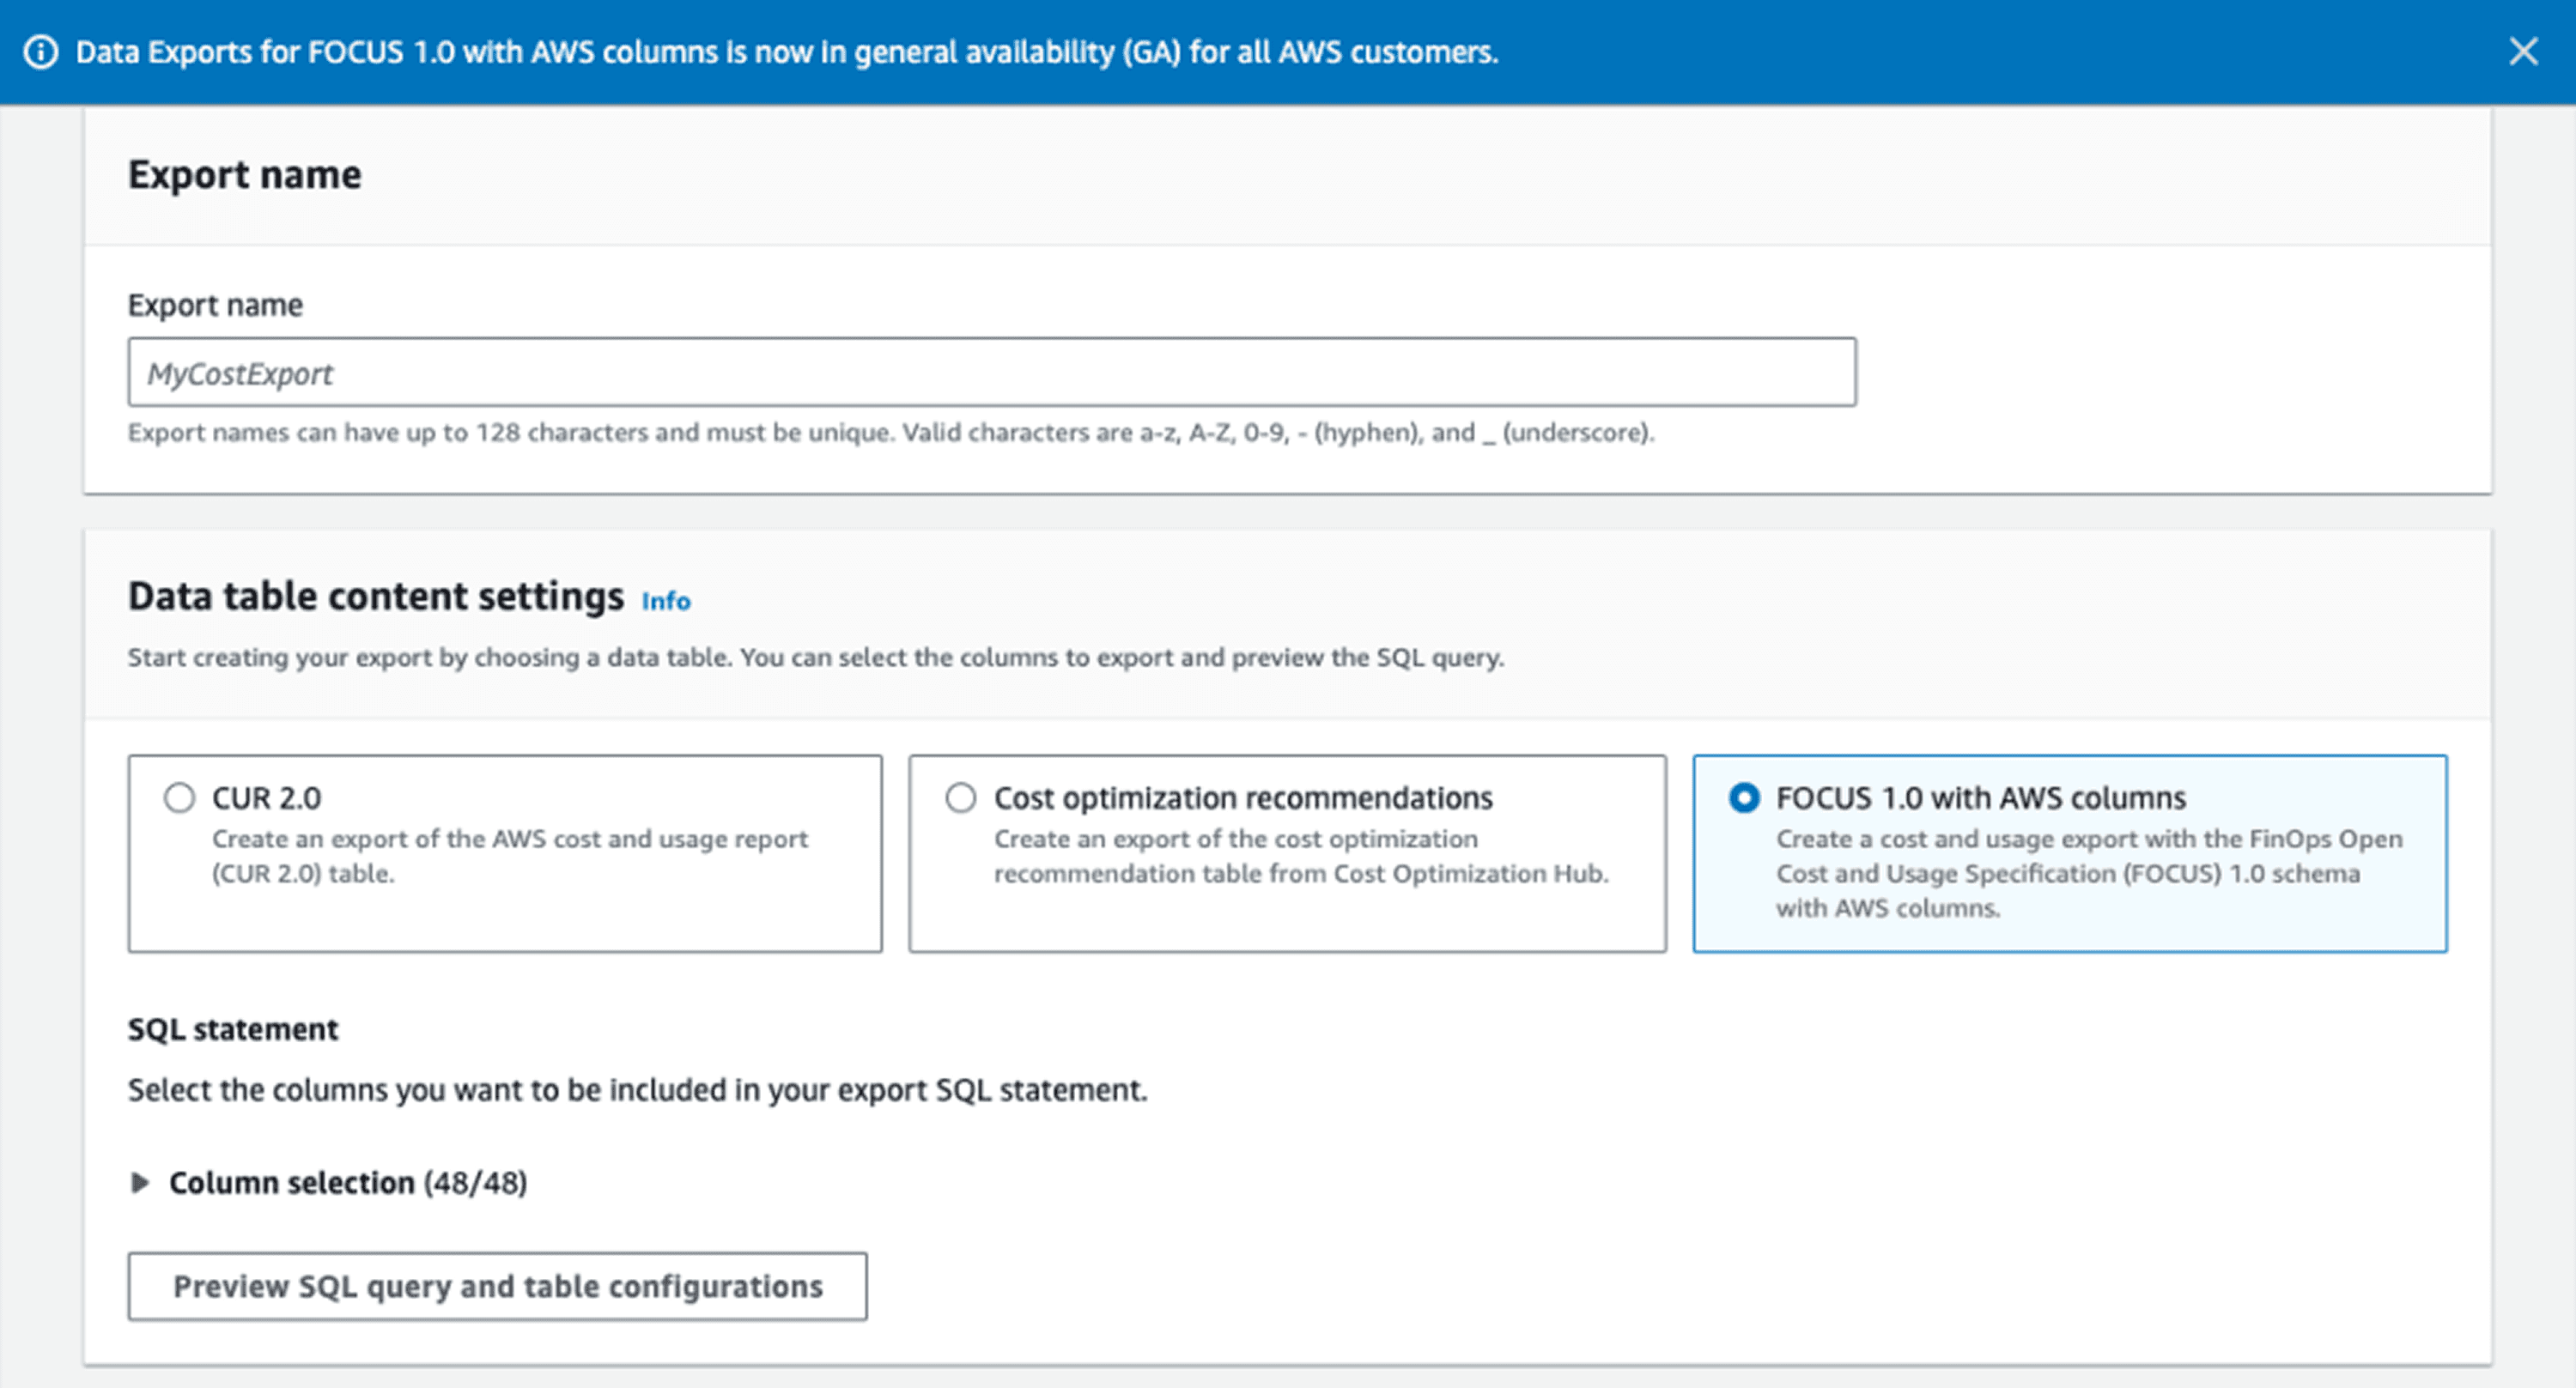
Major cloud providers like AWS, Azure and GCP are adopting FOCUS, and AWS announced support for FOCUS data exports at FinOps X 2024, allowing you to export data directly in FOCUS format.
Step 1: Navigate to AWS Billing Console → Data Exports → Create export
Step 2: Select FOCUS 1.0 as export format
Step 3: Configure S3 bucket and file preferences:
Export name: focus-export-monthly |
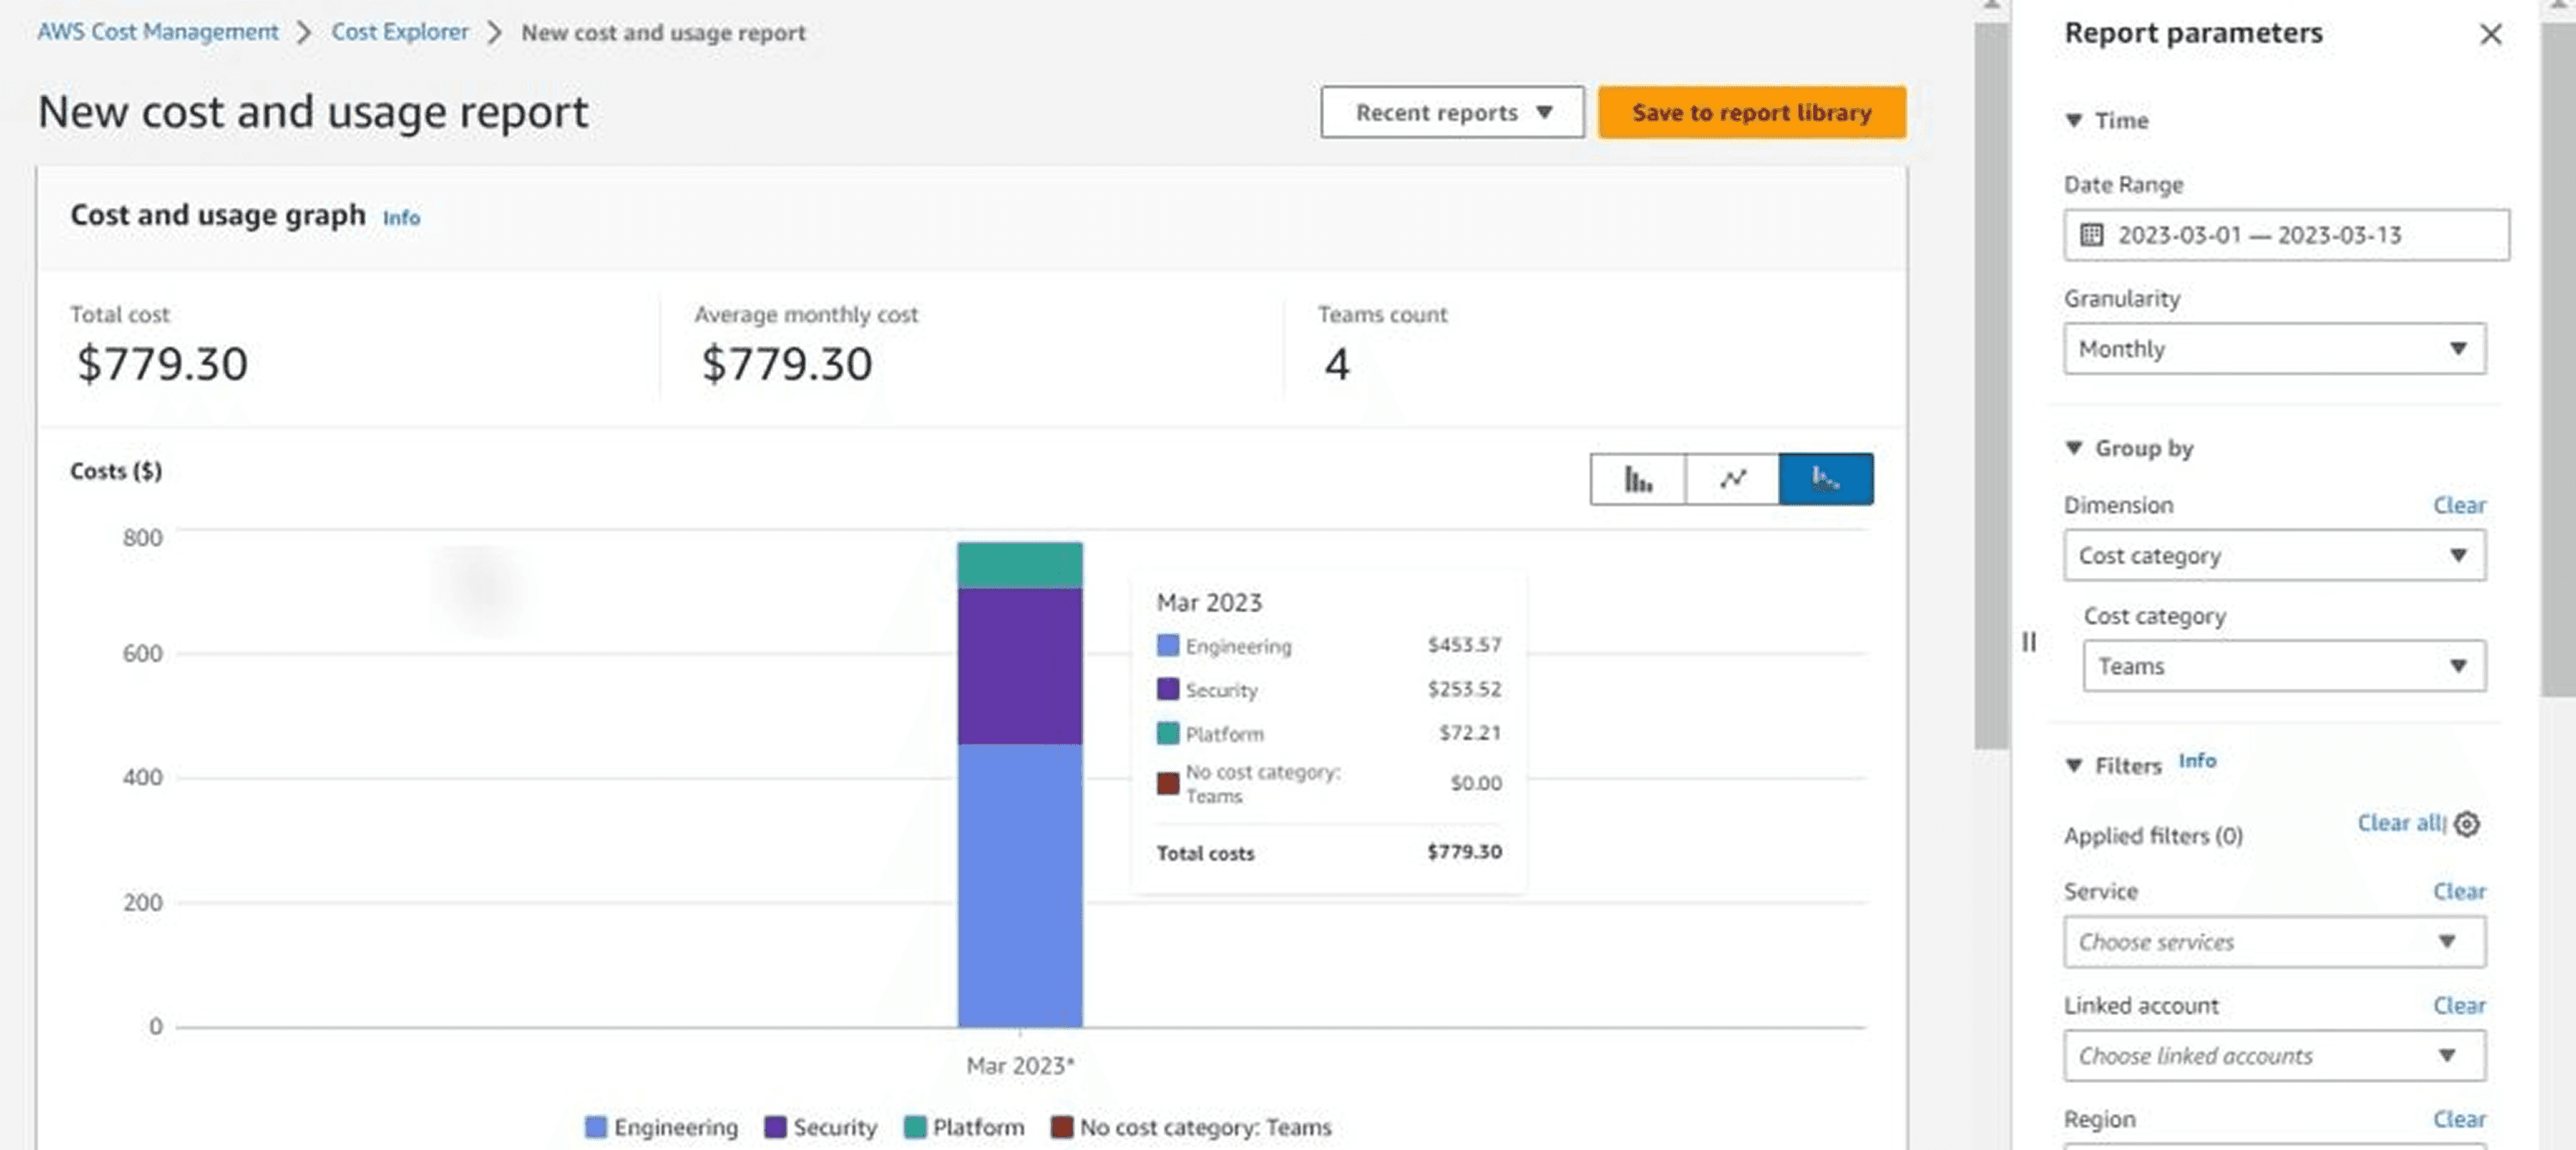
AWS Cost Categories for Coarse Grouping
Cost Categories enable top-down grouping without relying solely on tags:
{ |
FOCUS Column Mapping for Allocation
Key FOCUS 1.0 columns for allocation workflows:
FOCUS Column | Purpose | Equivalent CUR Column |
BilledCost | Actual charged amount | line_item_unblended_cost |
EffectiveCost | After discounts | line_item_blended_cost |
ResourceId | Unique resource identifier | line_item_resource_id |
ServiceName | AWS service | product_servicename |
Region | Geographic location | product_region |
Tags | All resource tags | resource_tags_* |
Handling Shared Costs: The Critical Challenge
Almost every organization has cloud costs that need to be segmented and allocated to business departments, including networking services, support costs which benefit all engineering teams, and service resources for which providers don't yet support tagging.
Common Shared Cost Categories
Infrastructure Platform Services:
VPC networking and data transfer
AWS Direct Connect or VPN
Route53 DNS services
CloudWatch centralized logging
Enterprise Support & Management:
AWS Support plans (business/enterprise)
AWS Organizations fees
Third-party monitoring tools (Datadog, Splunk)
Reserved Capacity & Commitments:
Reserved Instance subscription fees
Savings Plans commitments
Data transfer optimization services
Allocation Strategies for Shared Costs
1. Fixed Percentage Split: Simplest approach, suitable for crawl maturity
Total shared costs: $10,000 |
2. Proportional by Direct Spend: Allocates based on each unit's non-shared usage
Engineering direct: $50,000 (50%) |
3. Weighted Cost Drivers: Most accurate, requires telemetry
Network transfer costs allocated by: |
Practitioners at run maturity employ a weighted cost sharing model or develop custom models for managing shared costs.
30/60/90-Day Action Plan
Days 1-30: Discovery & Foundation
Week 1-2:
Conduct stakeholder interviews (finance, engineering, product)
Document current allocation state (if any)
Identify top 3 business questions cost data should answer
Run decision checklist (maturity, telemetry, tags, capacity)
Week 3-4:
Choose approach (top-down, bottom-up, or hybrid)
Enable CUR/FOCUS exports
Set up basic analytics infrastructure
Define initial allocation strategy document
Days 31-60: Pilot Implementation
Week 5-6:
Implement pilot allocation for 20% of spend
For top-down: Connect one telemetry source
For bottom-up: Tag pilot project resources
Calculate first-pass allocations
Week 7-8:
Validate pilot results with stakeholders
Document variances and lessons learned
Refine allocation rules based on feedback
Present initial findings to leadership
Days 61-90: Scale & Iterate
Week 9-10:
Expand coverage to 60-80% of spend
Automate allocation calculations
Build self-service reporting dashboards
Establish governance processes
Week 11-12:
Train teams on allocation methodology
Set up ongoing monitoring and alerts
Plan next maturity phase (walk to run)
Celebrate wins and quantify value delivered
Conclusion: Start Small, Think Big
The debate between top-down and bottom-up allocation isn't about choosing the "best" approach; it's about selecting the right strategy for your organization's current maturity, resources, and business objectives.
Start with top-down if: You need business metrics fast, have low tag coverage, or possess reliable telemetry connecting usage to value.
Build with bottom-up if: You have engineering capacity for tagging discipline, organizational structure drives allocation needs, or long-term precision justifies upfront investment.
Combine both when: You're maturing from crawl to run, need to validate one approach against another, or serve multiple stakeholder needs simultaneously.
The ultimate goal isn't perfect allocation but actionable allocation that drives better cloud financial decisions. As environments and business needs evolve, so must allocation practices, making continuous improvement a critical component of the FinOps journey.
Ready to transform your cloud cost visibility? Visit Opsolute to see how our Intelligent Showback and comprehensive cost allocation features can accelerate your FinOps journey, or book a free 20-minute implementation walkthrough to discuss your specific allocation challenges.
Frequently Asked Questions
Q: When should I pick top-down allocation over bottom-up?
Choose top-down if you need business metrics fast, have low tag/telemetry coverage (under 50%), or limited engineering resources. Top-down provides immediate value while you build tagging discipline.
Q: Can we combine top-down and bottom-up approaches?
Yes. Run top-down for immediate visibility while building bottom-up pipelines. Use top-down to validate bottom-up accuracy and vice versa. Many mature organizations use hybrid approaches for different business units.
Q: How do we handle shared costs like networking and AWS Support?
Use allocation drivers such as traffic, requests, CPU seconds, or seats to distribute shared costs. For unmeasured shared resources, use documented heuristics and monitor variance. Start with simple fixed percentages, then evolve to weighted models.
Q: What validation steps prove an allocation is "good enough"?
Compare to known ground truth (manual calculations), monitor month-over-month variance trends, review with product owners who know usage patterns, and set acceptable thresholds (typically 10-15% variance for crawl, under 5% for run maturity).
Q: Which tools support top-down vs bottom-up allocation?
Top-down: Opsolute, CloudZero, Vantage (telemetry-driven). Bottom-up: Cloudability, CloudHealth, Kubecost (tag-based). Hybrid: AWS Cost Categories + CUR, Azure Cost Management. Choose tools aligning with your approach and cloud providers.
Stop guessing what your AWS bill will be next quarter.
Connect your AWS Organization in under 30 minutes. Most customers see their first chargeback report in 14 days and realize a 5–10× return on Opsolute within 90 days.
