Most teams don't choose an observability stack based on cost. They choose it based on features, then discover the cost implications eighteen months later, when the bill has grown faster than the infrastructure it's monitoring.
That's not a coincidence. Datadog, Splunk, and OpenTelemetry solve overlapping problems with fundamentally different pricing models, and an observability cost management decision made without understanding those models tends to get expensive in ways that are hard to walk back once instrumentation is baked into a codebase.
Key Highlights
Datadog's per-host, per-GB pricing model means a mid-size deployment (200 hosts, 500GB daily logs, APM enabled) can run $15,000-$25,000 per month, with costs compounding across separately-billed modules.
Splunk's volume-based licensing starts around $150 per GB/day/year for on-premises deployments, and third-party buyer data puts the median enterprise Splunk spend around $60,000-$75,000 per year.
OpenTelemetry is free to adopt but not free to run: instrumenting with OTel can increase raw telemetry volume by 3-5x versus manual tracing, meaning the real cost management challenge shifts to backend pricing model choice, not the instrumentation layer itself.
The cost decision isn't really "Datadog or Splunk or OpenTelemetry", most cost-intelligent organizations use OpenTelemetry as the vendor-neutral instrumentation layer and route data to whichever backend (Datadog, Splunk, or a self-hosted option) makes economic sense per data type.
Datadog: Observability Cost Management at Per-Host, Per-Module Pricing
Datadog prices by host and by product module, separately. Infrastructure monitoring runs $15 per host/month on the Pro plan, scaling to $25 per host/month on Enterprise, and that's before APM, log management, or synthetic monitoring get added. APM alone adds $31-40 per host/month, log ingestion runs $0.10 per GB, and custom metrics carry their own per-metric fee.
The cost management challenge with Datadog isn't any single line item, it's that the modules compound. A relatively modest environment with 50 hosts, standard log volume, and APM enabled can land around $4,400 a month, or roughly $52,800 annually, and that math scales linearly (or worse) as host count and log volume grow. At enterprise scale, 500 hosts with APM and meaningful log volume, list pricing runs $358,000 to $678,000 per year before any negotiated discount.
Splunk: Observability Cost Management at Ingest-Volume Pricing
Splunk's pricing logic is different: you pay primarily for data ingested per day, not per host. That model was built for Splunk's roots in large-scale log and security data, and it shows in the pricing, Enterprise pricing starts at roughly $150 per GB/day/year for on-premises deployments, with Splunk Cloud carrying a premium over that.
This ingest-based model creates a specific cost management risk: volume growth is punished linearly, and there's no way to "right-size" your way out of it the way you might right-size an underused EC2 instance. Third-party buyer data puts the median Splunk buyer paying $75,311 a year, with annual costs ranging from $1,800 for a 1GB/day deployment up to $800,000 for large-scale enterprise environments. If your log volume is genuinely large and security/compliance-heavy, Splunk's depth justifies the cost. If it's growing for reasons unrelated to the value you're extracting from it, the ingest-based model has no built-in mechanism to catch that.
OpenTelemetry: The Free Layer With a Real Operational Cost
OpenTelemetry is open-source and free to adopt, but "free" only describes the instrumentation standard, not the total cost of running an observability stack on top of it. Two things matter here for cost management specifically.
First, instrumenting with OpenTelemetry often increases telemetry data volume by 3-5x compared to manual tracing, since OTel's default instrumentation tends to be more comprehensive than hand-rolled tracing. If that volume routes into a per-GB backend without any filtering, the bill goes up before any cost benefit shows up.
Second, and this is the actual value proposition, OpenTelemetry decouples instrumentation from the backend. You instrument once, then route data to whichever backend makes economic sense per data type: premium vendors for high-priority traces, cost-effective open-source backends for routine logs, cold object storage for compliance archives. This is exactly the strategy behind the case in our guide to cost-intelligent monitoring: a financial services company cut observability spend from $840K to $235K annually by routing telemetry through OpenTelemetry to a self-hosted ClickHouse backend instead of a premium SaaS vendor, same visibility, different economics. Organizations taking this approach report 50-72% cost reductions, but only once the routing and filtering strategy is actually in place, not from adopting OpenTelemetry alone.
Observability Cost Management: Comparison at a Glance
Datadog | Splunk | OpenTelemetry | |
Pricing model | Per host + per module (APM, logs, synthetics billed separately) | Per GB ingested per day | Free instrumentation; cost lives in backend + volume |
Typical mid-size cost | ~$15K-25K/month at 200 hosts, 500GB/day | ~$60K-75K/year median enterprise spend | Varies entirely by backend choice |
Cost risk | Module compounding as products get added | Linear penalty on ingest volume growth | 3-5x volume increase if unfiltered |
Best cost-management lever | Aggressive log retention tiering | Volume reduction via filtering before ingest | Smart routing to cost-appropriate backends |
Why This Is a Cost Governance Problem, Not Just a Tool Choice
Choosing between Datadog, Splunk, and OpenTelemetry is often treated as a procurement decision, made once, revisited rarely. From a cost governance standpoint, that's the mistake. Observability spend behaves like any other cloud cost category covered in cloud cost control strategies: it grows quietly with every new service, every added dashboard, every retention window nobody revisits, unless someone owns reviewing it on a cadence.
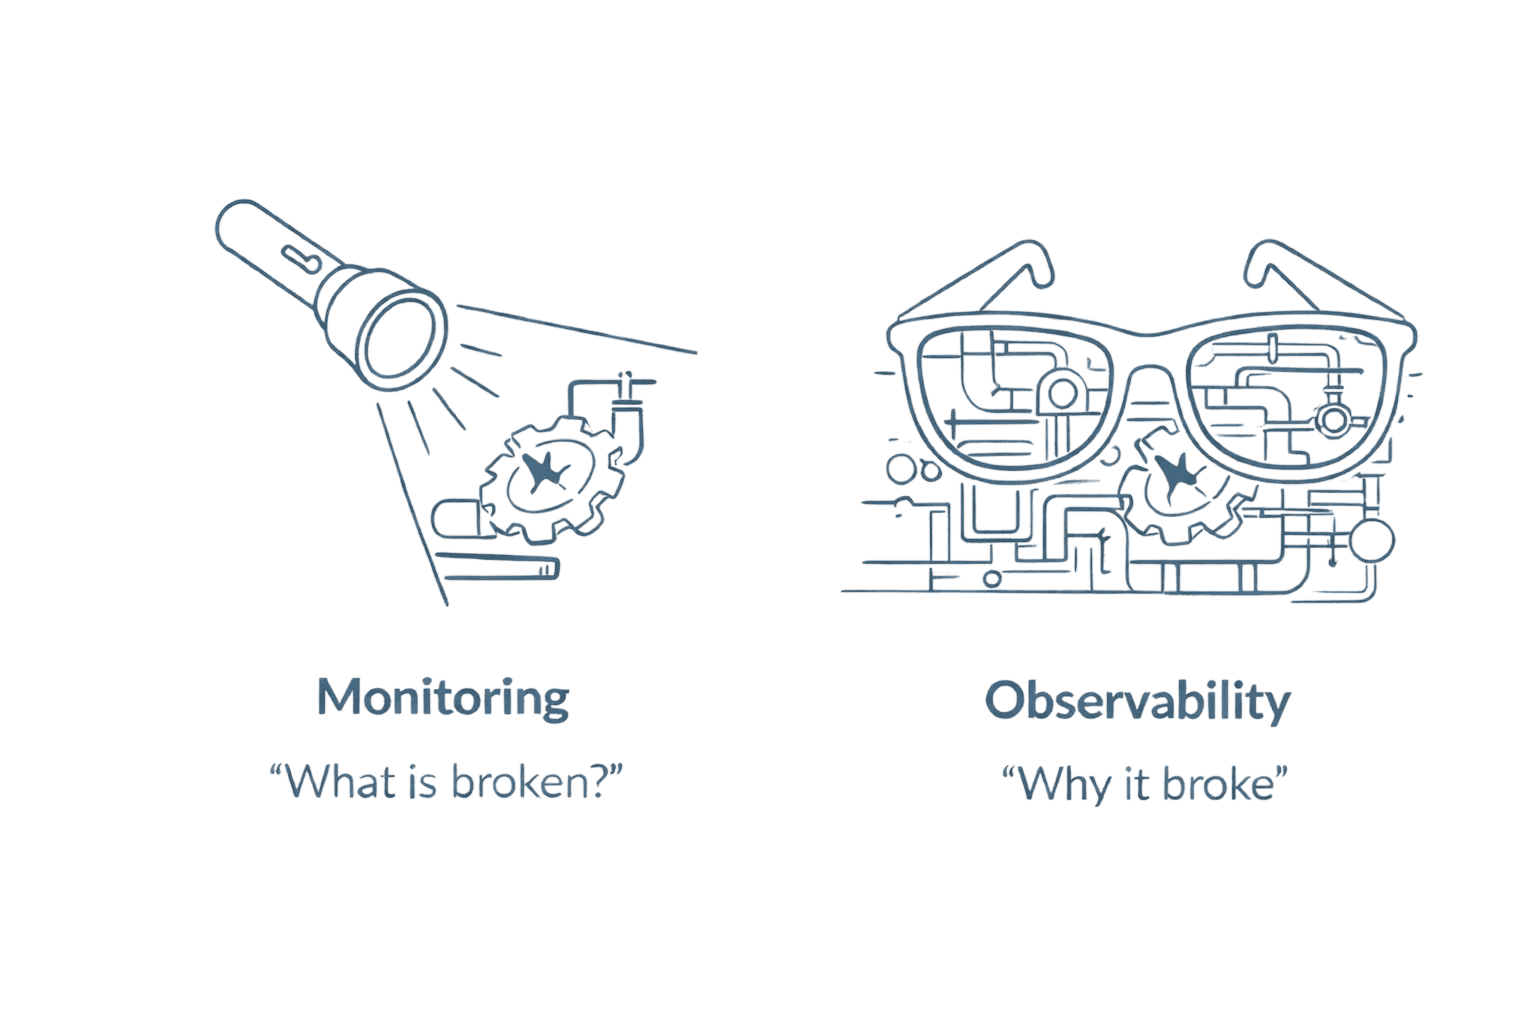
The distinction between observability and monitoring matters here too. Monitoring tells you a service is down. Observability tells you why, and that "why" is exactly the high-cardinality, high-volume data that drives the cost differences between these three approaches. A team that only needs monitoring is paying for observability-grade pricing unnecessarily; a team running distributed microservices genuinely needs the depth, but should choose the pricing model that fits its actual data shape, not the vendor with the best sales demo.
Building an Observability Cost Management Strategy That Works
The teams that manage observability cost well tend to converge on a similar pattern, regardless of which vendor sits at the center: instrument with OpenTelemetry to stay backend-agnostic, tier data by value (hot storage for active debugging, cold storage for compliance), and set observability budgets with the same guardrails applied to AWS cloud cost optimization generally, thresholds that trigger review before a bill compounds, not after.
Datadog's depth and ease of use justify its premium for teams that value an integrated platform over cost efficiency. Splunk's ingest model fits organizations with genuinely large, security-heavy log volumes where the platform's analytics depth pays for itself. OpenTelemetry is the right foundation for any team that wants to keep those choices reversible, since the instrumentation layer, not the backend, is where vendor lock-in actually gets built.
Where Opsolute Fits In
Observability cost doesn't exist in isolation from the rest of a cloud bill, it's cloud infrastructure spend like any other, and it needs the same visibility, allocation, and guardrails. Opsolute connects observability and infrastructure cost data so teams can see whether a spike came from the monitoring stack or the systems it's watching, and set budget guardrails across both without treating them as separate line items reviewed by separate teams.
The Bottom Line
There's no universally cheapest observability stack, only the stack that fits your actual data volume, retention needs, and willingness to operate infrastructure yourself. What determines whether that choice stays affordable over time isn't the vendor, it's whether cost is reviewed on a cadence, the same discipline that makes any cloud cost governance program work.
Ready to see observability spend alongside the rest of your AWS cost picture? Book a 30-minute demo and see how Opsolute brings monitoring and infrastructure cost into one accountable view.
FAQ
Q: Is Datadog or Splunk cheaper for observability? A: It depends on data shape. Datadog's per-host, per-module pricing tends to favor smaller, infrastructure-heavy environments, while Splunk's per-GB ingest pricing tends to cost more as log volume scales, regardless of host count. Neither is reliably cheaper across all workload types.
Q: Does adopting OpenTelemetry save money by itself? A: Not automatically. OpenTelemetry can increase telemetry volume by 3-5x versus manual tracing. The savings come from the flexibility it provides to route data to cost-appropriate backends, not from the instrumentation standard itself.
Q: Can Datadog, Splunk, and OpenTelemetry be used together? A: Yes, and this is increasingly the norm. OpenTelemetry is commonly used as the vendor-neutral instrumentation layer, with data routed to Datadog or Splunk for high-value traces and a cheaper backend for routine logs.